Advanced geospatial technology and research for civic and social impact.
Technical articles and stack decisions from Azavea
Our next era: Azavea joins Element 84
As of February 16, '23, Element 84 has acquired Azavea. Together, we look forward to creating solutions for pressing global challenges.
Cicero-NLP: using language models to extend the Cicero Database
We discuss how to make US Representative contact information easier to collect through automation using Natural Language Processing.
The Importance of the User Experience Discovery Process
Outlining the value behind the user experience discovery process, including how it adds clarity and helps to establish an aligned vision.
Introducing: Raster Vision v0.20
We dive into the new Raster Vision release, V0.20, introducing new features, improved documentation, and a new way to use Raster Vision.
A deep dive into Azavea’s employee benefits: why we prioritize offering top-tier benefits as a small business
In this post, we highlight the employee benefits we offer and outline why offering top-tier benefits aligns with our mission.
Why is some documentation better than others?
We outline what documentation is, who it's for, and how to ensure your documentation is accessible for both users and developers.
Selecting a Geospatial Mastodon Server for Individuals and Businesses
While choosing a Mastodon server, you should evaluate your desired community size, rules, and the instance's focus. Here's how we did it.
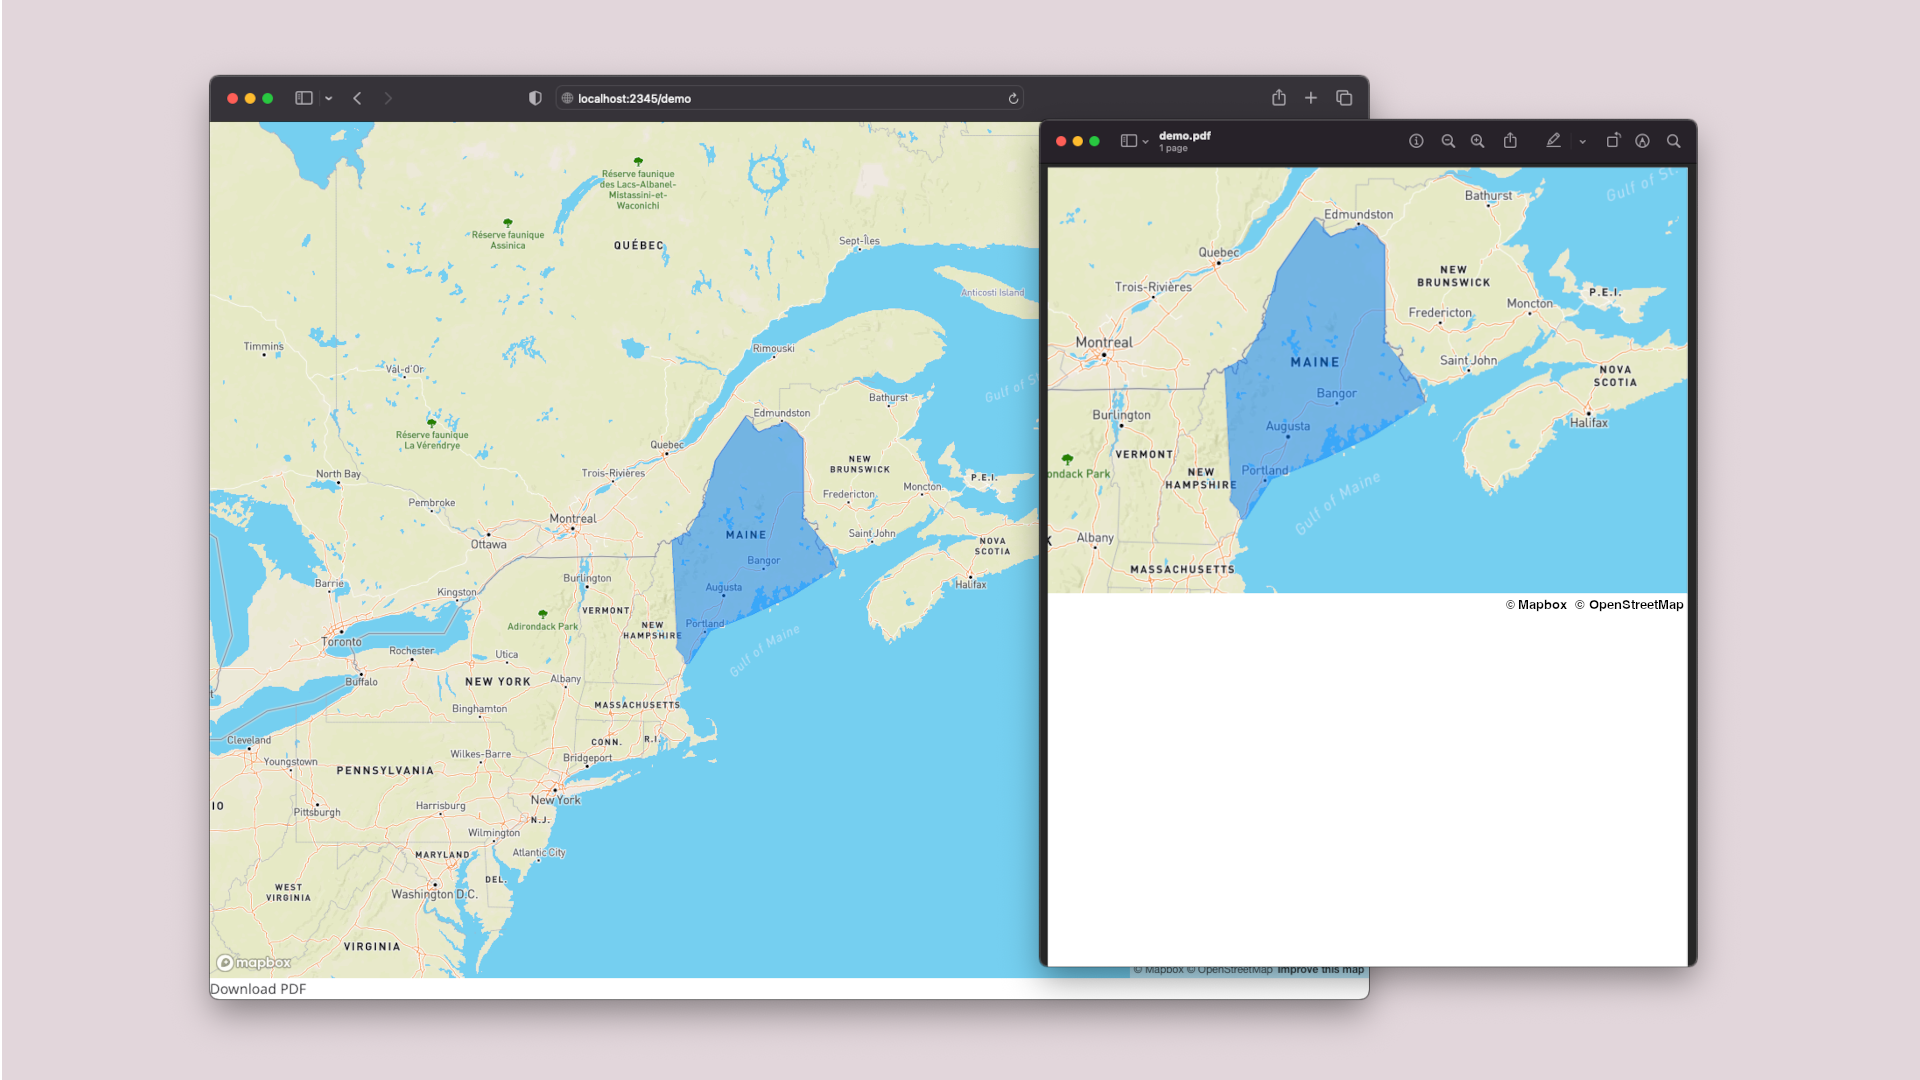
How to print a MapBoxGL.js map to a PDF in React
To generate a printable document that is well-formatted, we break down the implementation process to print a Mapbox map to a PDF in React.
The Bread and Butter of Software Development: Informing My Learning Through Professional Baking
Azavean Rachele Morino outlines her career transition from baker to software engineer, and where the two professions overlap.
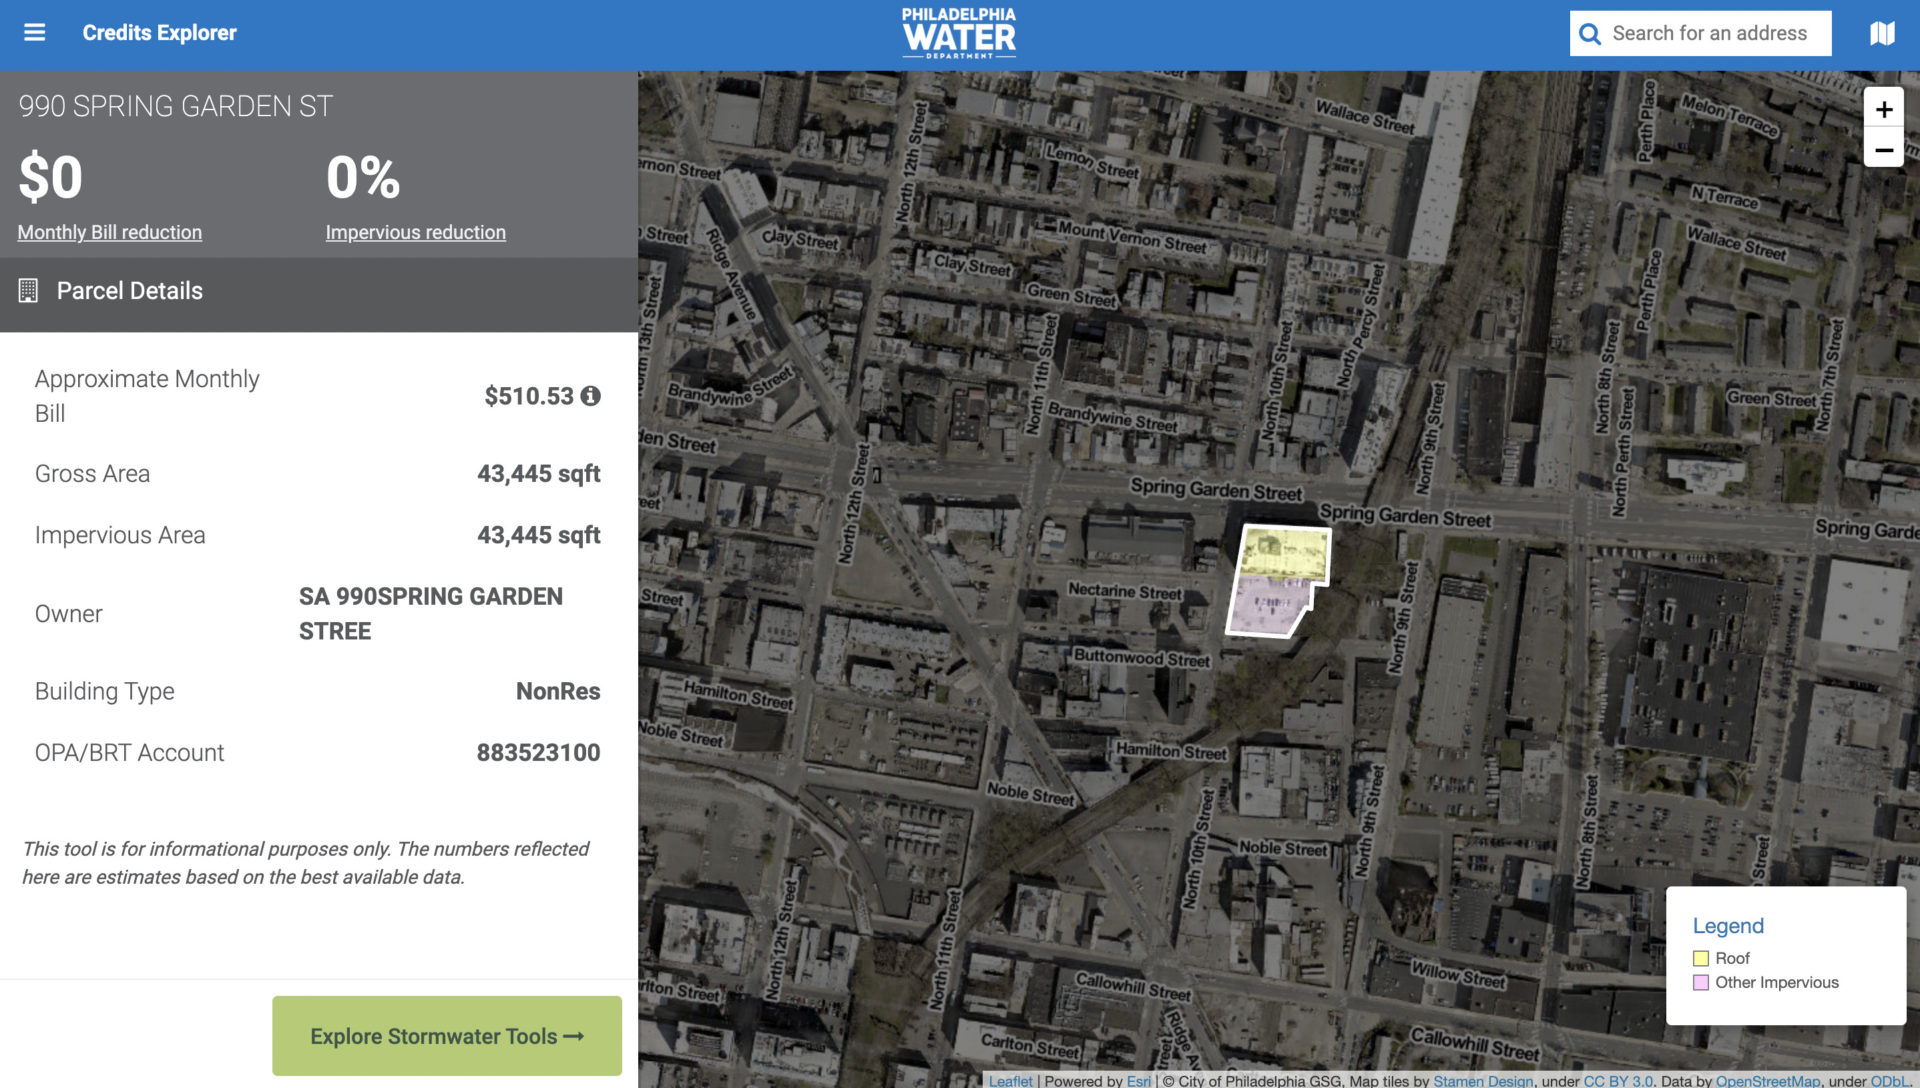
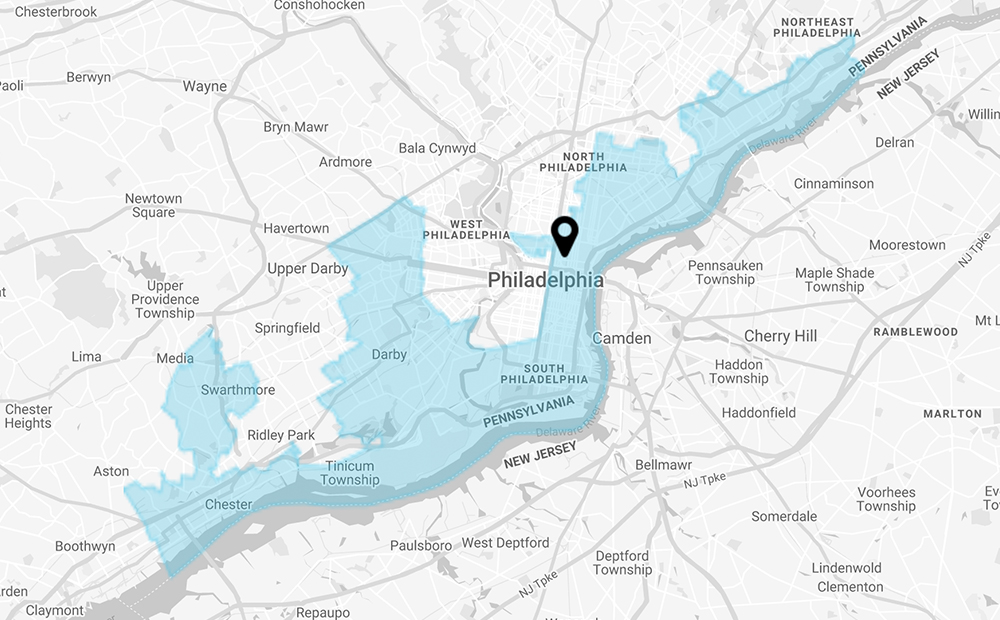
14 Years of Helping to Manage Stormwater in Philadelphia
A recap of Azavea's partnership with the Philadelphia Water Department to support stormwater management in Philadelphia.
Building a fast-loading and responsive application using Next.js
Due to Next.js' ability to populate webpages in remote areas, we used it to build a decision-support tool that conveys landslide risk.
1% For Open Source: Financial Support for Tools We Use
Due to Azavea's use of open source software, we believe that we have a responsibility to help support it. Learn more about how we give back.
Introducing Azavea’s Climate Change Learning Group
What is the Climate Change Learning Group? At Azavea, we’ve woven climate initiatives into the identity of our business. As...
How the Census counts people living in group quarters and what it means for redistricting
The US Census counts most people in their residence using the household survey, but the group quarters count also impacts drawing boundaries.
Why We Haven’t Taken on Investment
20 years on, Azavea has never taken on investor capital. Azavea's CEO, Robert Cheetham, explains why this is the case.
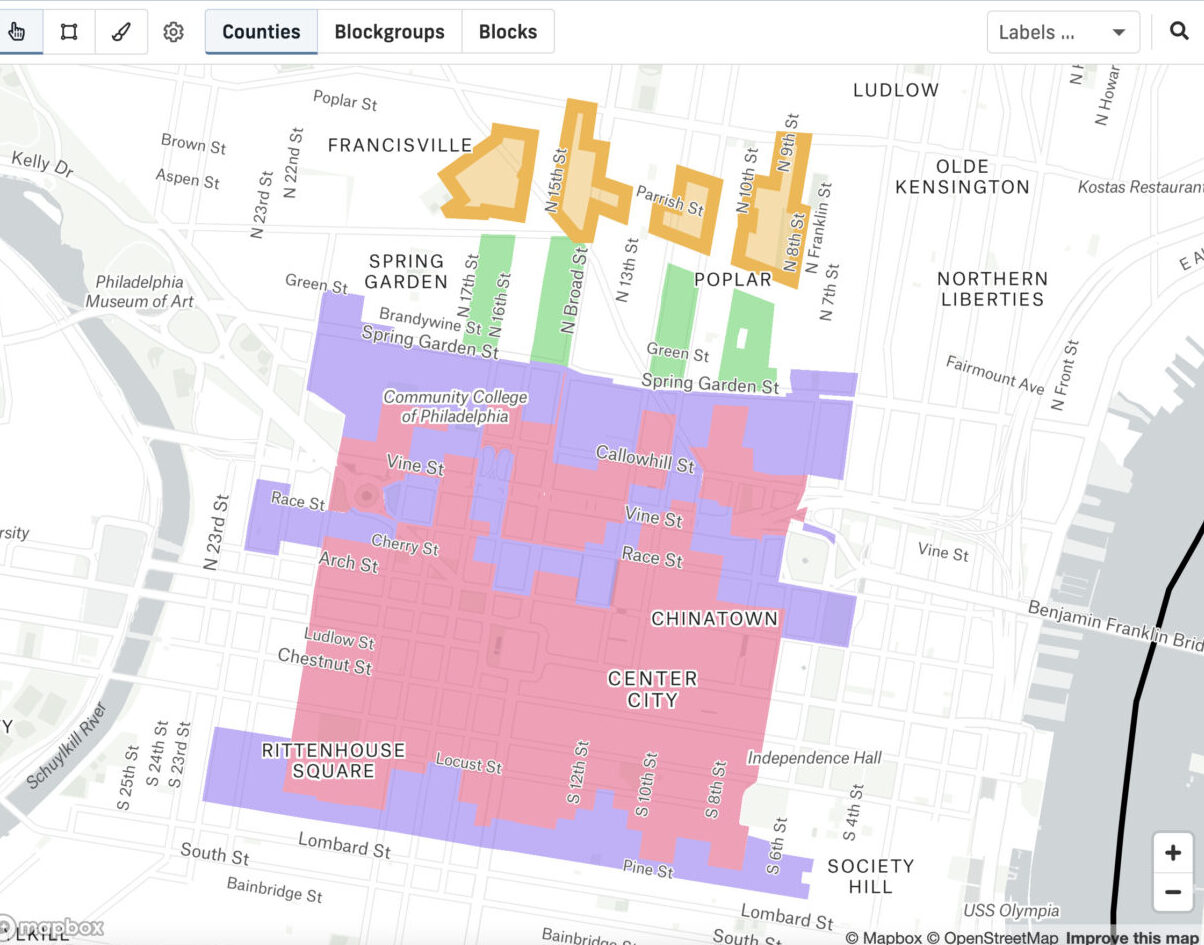
How to code-split GeoJSON layers for your MapBoxGL.js React apps
A recent project required us to implement an interactive map of the United States with a custom counties layer. This is what we learned.
Change detection with Raster Vision
We show how Raster Vision can be used to quickly train a geospatial change detection model using the OSCD dataset as an example.
Highlighting NumFocus Projects: How Open Source Projects Empower Our Work
NumFocus is a nonprofit that supports many open source tools used in Azavea's projects. Here, we highlight how they have supported our work.
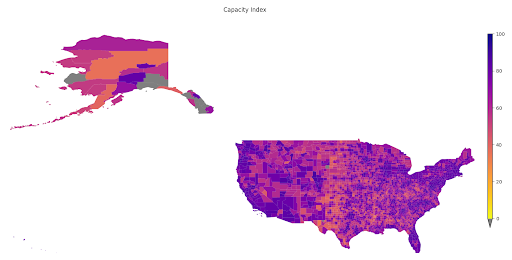
A Tool to Highlight Underfunded and Under-resourced Communities: A Peek Behind the Technical Curtain of Headwaters Economics’ Rural Capacity Index
To address the disparity in access to funding resources, we partnered with Headwaters Economics to develop the Rural Capacity Index.
Our Top 3 Netlify Use Cases: Deciding When to Use Netlify
Netlify is a platform for web developers and designers that offers hosting and serverless backend services. Here, we provide Azavea's top three use cases for it and its benefits for our software engineers and designers.
Create a Windows Application Without Windows
All of Azavea's developers are on Mac or Linux, but our engineering teams still can do Windows work using .NET Core.
Evolution of DEI Efforts at Azavea
At Azavea we strive to create a diverse, equitable, and inclusive work environment. As we consider how to thoughtfully grow and strengthen our workplace, we reflect on what we have learned over the years in order to chart our path forward.
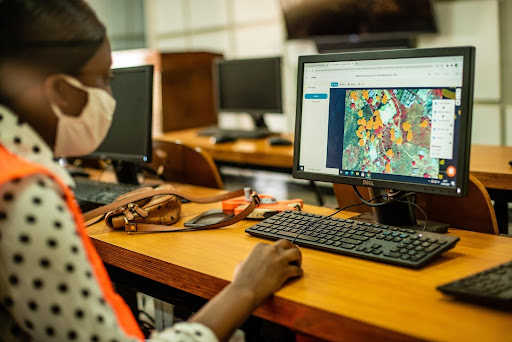
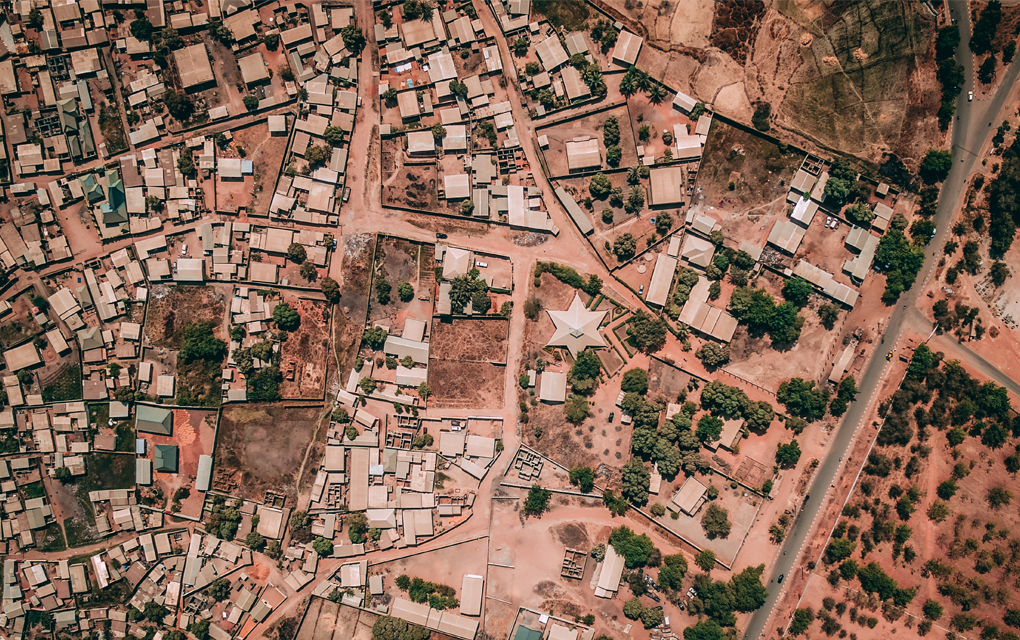
Machine Learning to Drive Urban Resilience: Mapping Tree Canopy with the World Bank
As one of seven pilot programs to address environmental issues in Africa, Azavea trained student workers to label satellite imagery using GroundWork and created a machine learning model to identify tree canopy.
2022 Trends in Geospatial
Azavea's CEO Robert Cheetham provides 6 trends he foresees in geospatial this year. These predictions are grounded in Robert's personal experience and perspective as Azavea CEO.
How a Small Tech Company Has Adjusted to the Hybrid Work Environment: Insights from 2021
2021 brought a lot of challenges to tech companies and many have concerns leading into 2022. Considering how much we learned from 2021, as the year came to a close we gathered learnings from our colleagues to help us work effectively in 2022. We wanted to share some of these tips and plans for this upcoming year as a way to support our friends in the tech-for-good community.
Top 7 Reasons to Make Your Excel Spreadsheet into a Web-Based Application
We’ve seen a trend in requests from potential clients. Organizations are bringing us complex, built-in-house Excel spreadsheets and asking us to convert them into web-based decision-support tools to make their data more useful, user-friendly, and secure.
Announcing the Winners of Map Across America: A National Redistricting Competition
DistrictBuilder, Azavea’s free redistricting tool, recently held a competition in partnership with the Public Mapping Project to encourage more participation in the redistricting process.
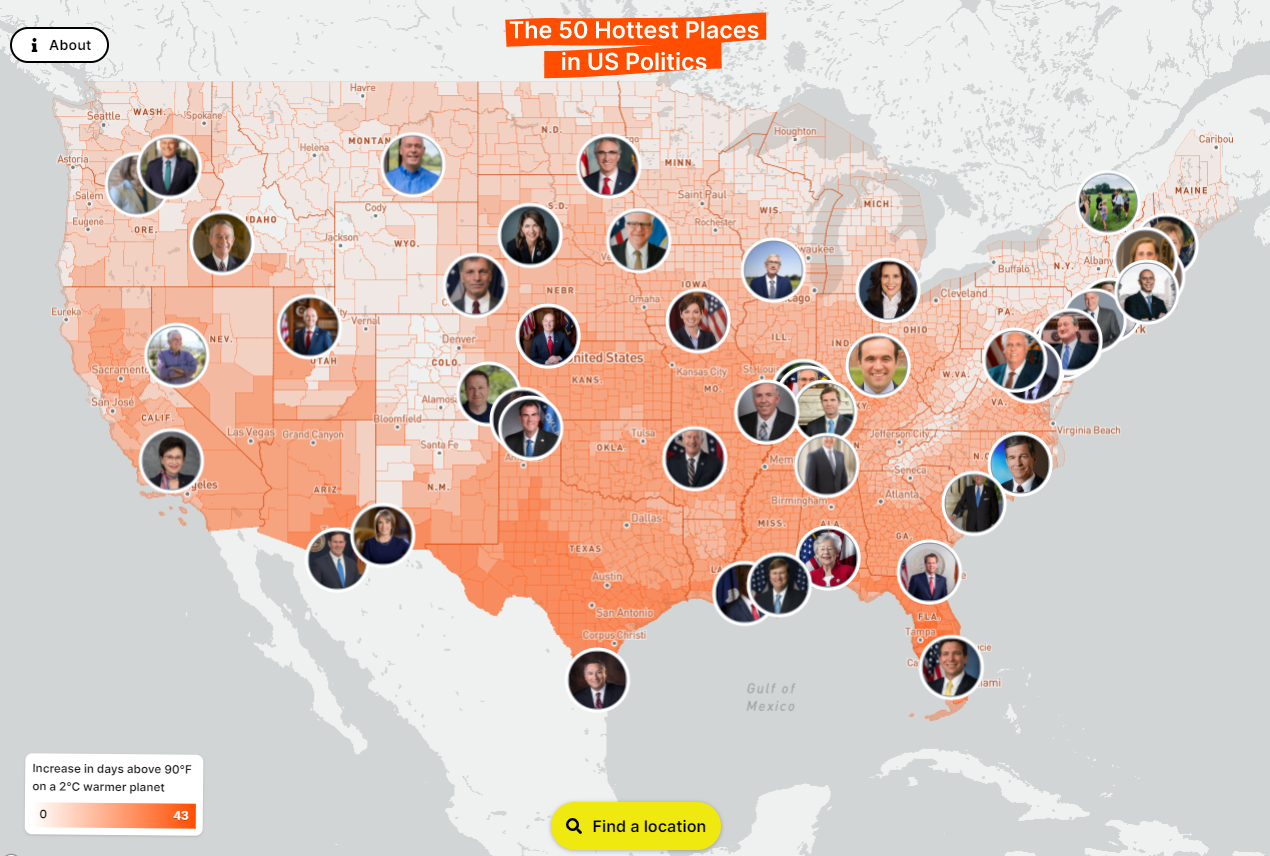
Partnering with Probable Futures to Visualize Climate Change Data and Inspire Action
With Probable Futures, Azavea designed a web-based tool that informs the public on the local impacts of climate change and drives action.
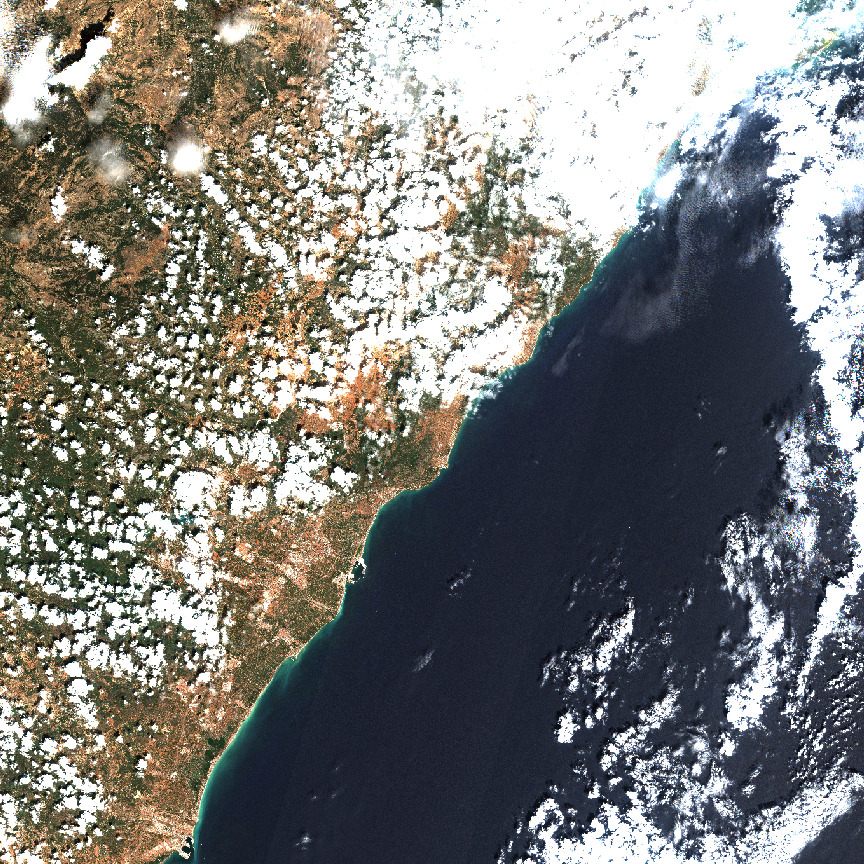
The Azavea Cloud Dataset
Azavea is releasing a dataset consisting of 32 unique Sentinel-2 tiles with cloud labels produced by humans.
Improving City Transit Networks through Data and Public Policy
Using open source data and easily customizable software, Azavea worked with PeopleForBikes to improve city transit networks.
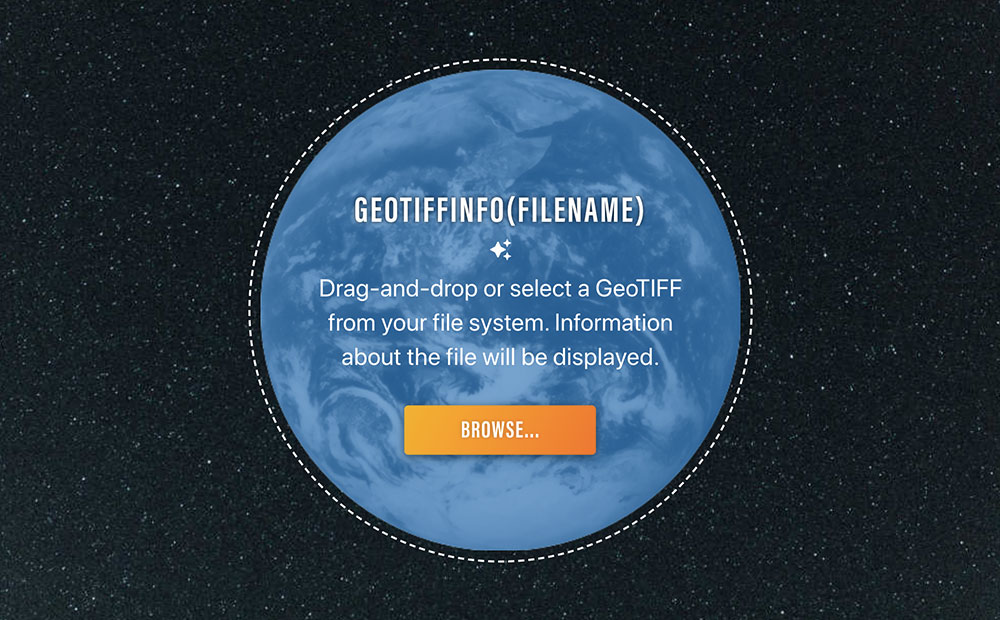
Introducing Loam: A Client-Side GDAL Wrapper for Javascript
We've built a GDAL wrapper library called Loam. Loam is a client-side GDAL wrapper for Javascript.
Labeling SAR Imagery for Machine Learning: A Beginners Guide
Does SAR imagery mystify you? Learn more about SAR data and best practices on labeling them to create training sets for machine learning models.
Introducing Raster Vision 0.13
The Raster Vision 0.13 release introduces several new features that allow for finer control of the model training as well as greater flexibility in ingesting data.
Getting Started with STAC APIs
STAC is a specification for enabling online search and discovery of geospatial assets. You can get started with a number of STAC APIs.
GroundWork Launches Campaigns
Need to create a training dataset that contains multiple images? GroundWork launches "Campaigns" to help you handle large datasets for machine learning.
This Month We Learned — February 2021
This month we learned more about PostgreSQL indexing. Speed up fuzzy match searches with tri-gram indexes, but jsonb indexes aren't perfect.
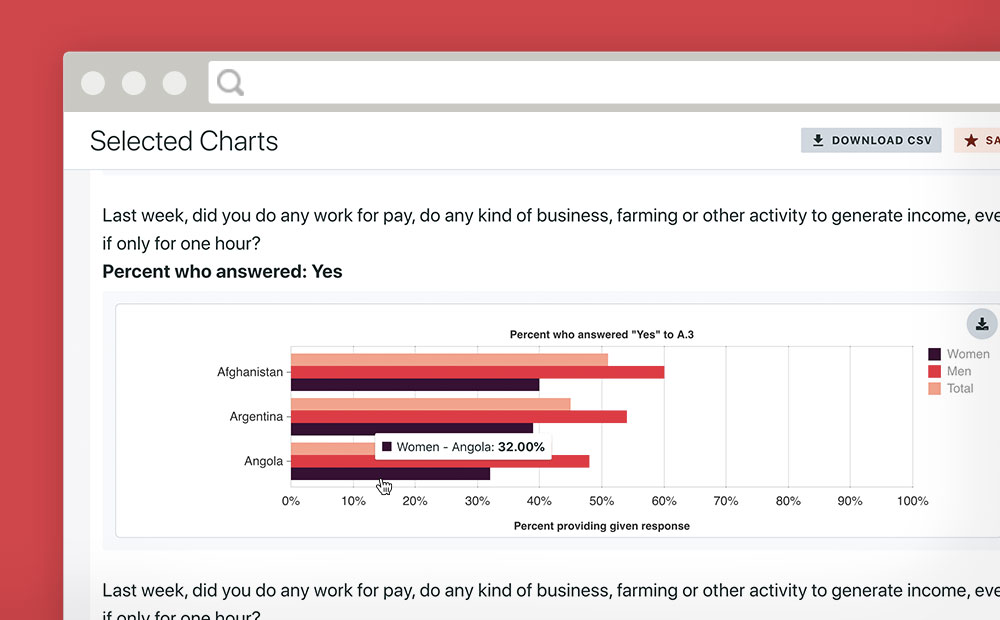
Making Gender Data Actionable
Azavea partnered with Facebook and Ladysmith to make an engaging platform that makes data from a massive gender survey actionable.
Azavea Joins the Stripe Climate Effort for Carbon Removal
Azavea joins the Stripe Climate effort and will contribute 2% to carbon removal technologies as a part of our commitment to the environment.
Cloud Detection in Satellite Imagery
We use different machine learning models to detect clouds in satellite imagery over four different geographic settings.
This Month We Learned – December 2020
This month we learned about planning five years of a project, performance debugging with tracing, and jsonlint.
Load Testing a TMS Tile Server with k6.io
A tutorial on load testing a TMS tile server with k6.io, which results in clear and more accurate group statistics.
STAC Labeling Competition — Video Recap
Video of STAC data labeling competition participants on why training data for machine learning is important.
A Day in the Work-Life in 2020
2020 was awful. Who was accessible changed radically. We, and the people around us, by necessity took on different roles. Including at work.
This Month We Learned — November 2020
This Month We Learned about people-first hiring and onboarding and using nix-shell for consistent development environments.
Managing Data Labeling for Machine Learning Projects
Responsible for the data labeling for a machine learning project? Here are some insights I’ve developed while managing data labeling for machine learning.
This Month We Learned — October 2020
This month we learned about the React DevTools profiler, medium-term visits to different teams, and numpy tiles.
A Guide for Grantmakers: How to Evaluate Software Development Proposals
We created a guide for evaluating software development proposals to aid grantmaking organizations in assessing project impact.
Run-Time Type Checking in TypeScript with io-ts
In this post, we'll be using some advanced TypeScript libraries (io-ts) to help us stay type-safe even in the face of unknown inputs.
This Month We Learned — September 2020
A monthly blog on things Azaveans learned – at work or in the real world. This month features MapboxGLJS, Google Tag Manager, and basil.
Top 5 Data Visualization Practices: A Case for Effectively Communicating Information About US Wildfire Risk
5 best practices for nonprofit and government leaders when designing compelling data visualizations to make data useful.
Three Lessons from Running an Imagery Labeling Competition
Lessons learned from engaging non-technical folks in labeling and running a competition labeling clouds in freely available satellite imagery.
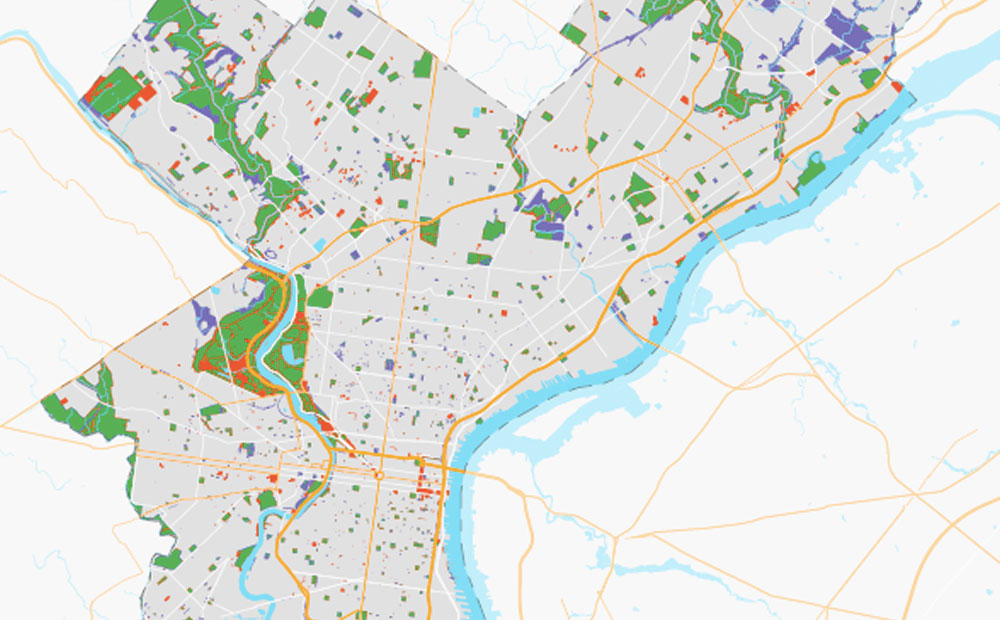
How Can OpenStreetMap be Used to Track UN Sustainable Development Goals?
An analysis comparing OpenStreetMap data to municipal open data portals on public green space proved that OSM could be a valuable source for tracking SDGs.
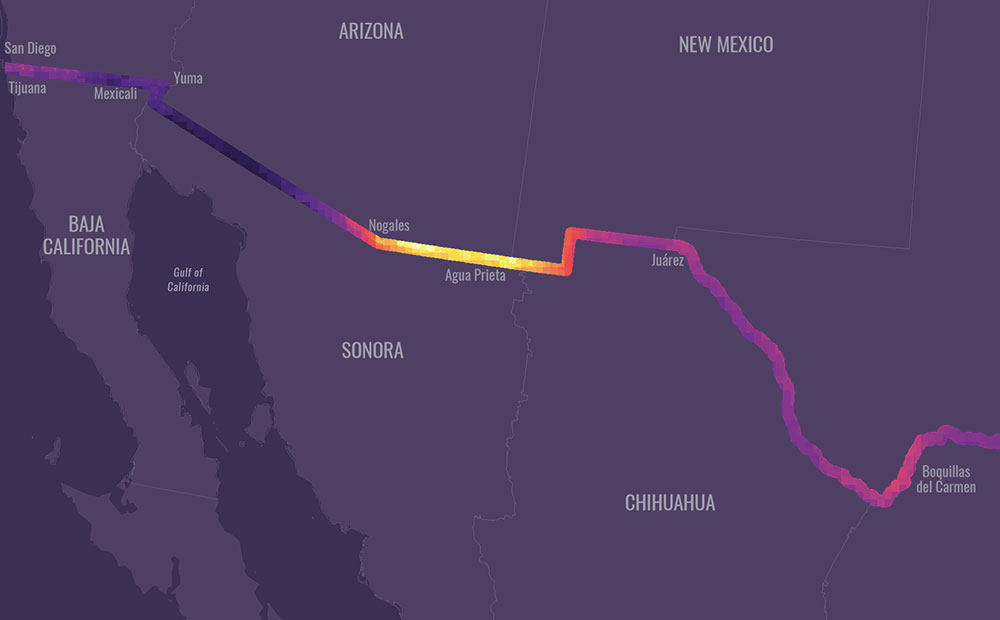
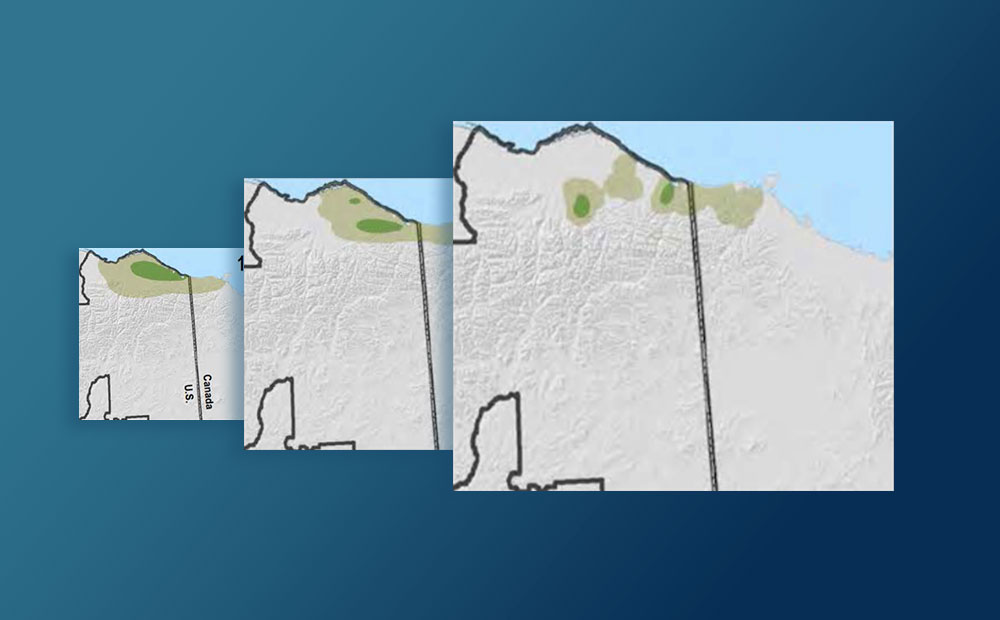
Using GIS to Examine the U.S.-Mexico Border Wall’s Impact on Wildlife
We used GIS to study the environmental impacts of the propose wall on the U.S.-Mexico border in order to prioritize increased conservation efforts.
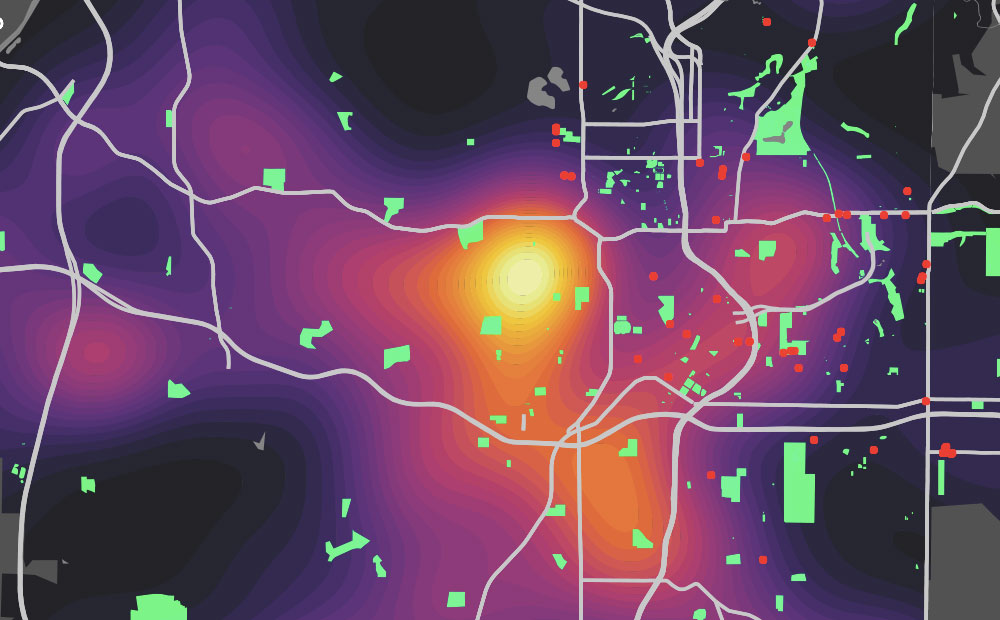
Choosing a Cell Size for Point Pattern Analysis: Gun Crimes in Baltimore
This analysis applies the Malleson methodology of choosing a spatial unit of analysis to gun crime data for the city of Baltimore.
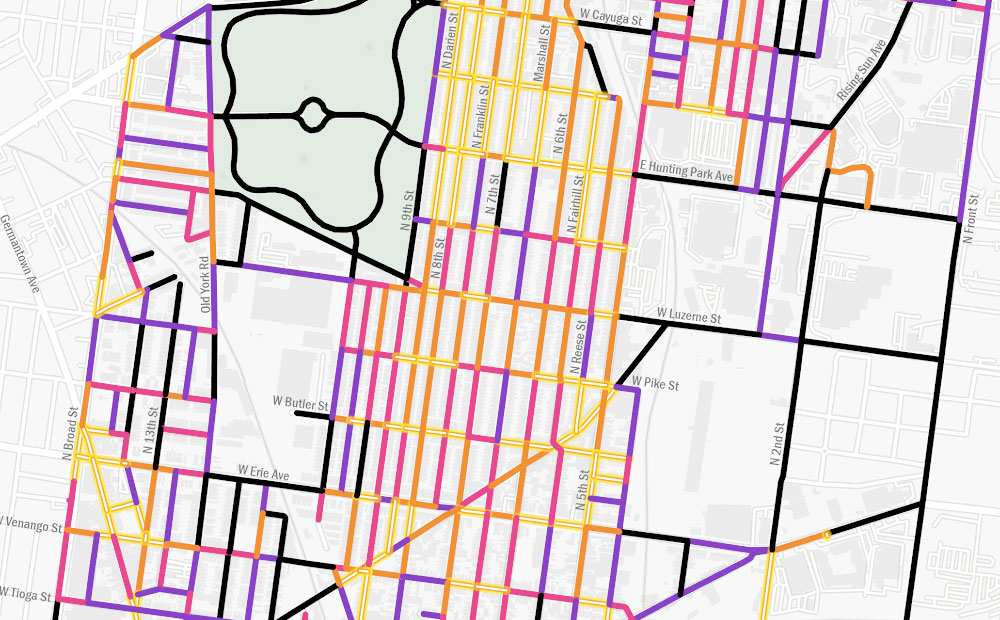
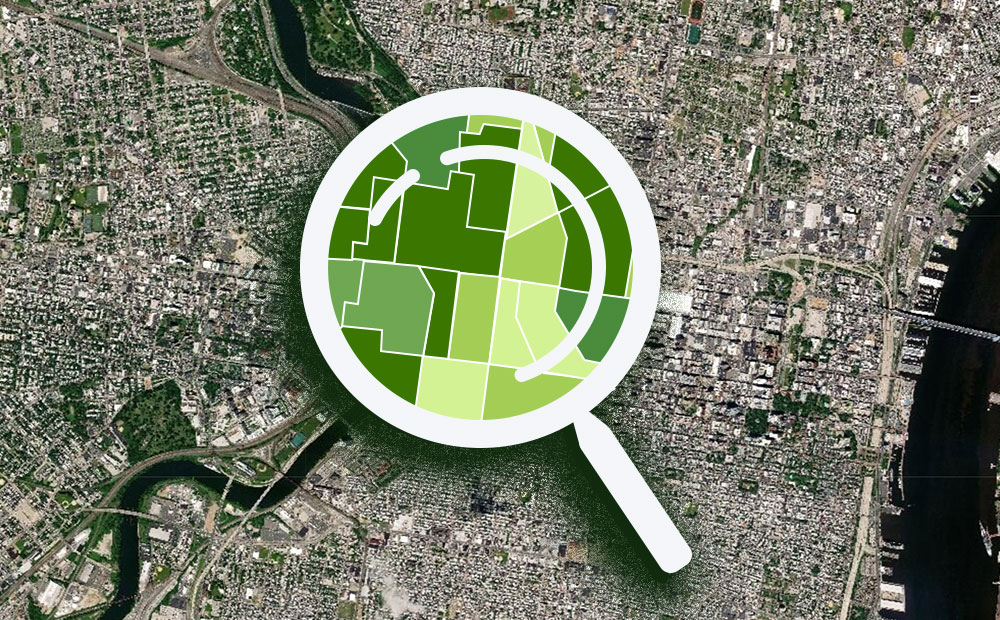
Using GIS to Guide Philadelphia’s First Neighborhood-Level Forestry Plan
This analysis uses GIS to prioritize and guide tree-planting efforts to increase the tree canopy as a part of a neighborhood forestry plan.
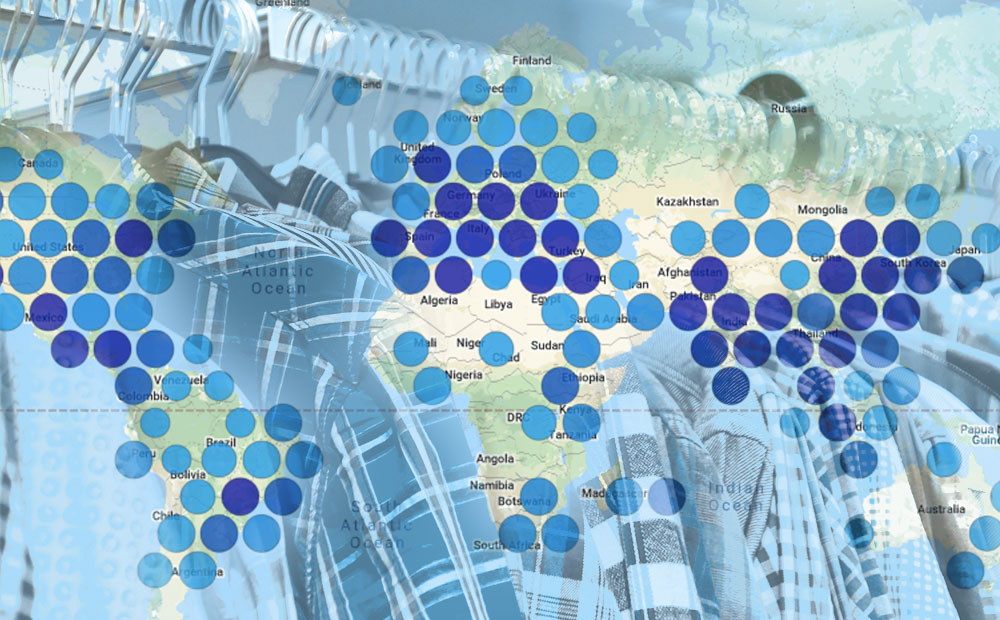
Bringing Open Data to the Apparel Industry
Interview with the Open Apparel Registry team about using open data to encourage transparency in the apparel industry
This Month We Learned — July 2020
TMWL is a recurring blog series where Azaveans share a new thing they learned. In July, we learned about fancy responsive CSS borders and OBS Studio scenes.
PySTAC 0.5.0 for STAC 1.0.0-beta.2
PySTAC 0.5.0 for STAC 1.0.0-beta.2 is released! Read more about this release and the future of PySTAC here.
Amazon Web Services and Amazon Rain Forests: A Software Architectural Review
WRI hired Azavea to perform a software architectural review to evaluate the technical organization of Global Forest Watch.
The Business Case for Raster Vision
Use Raster Vision in your business to give you a competitive advantage in the field of earth observation and deep learning.
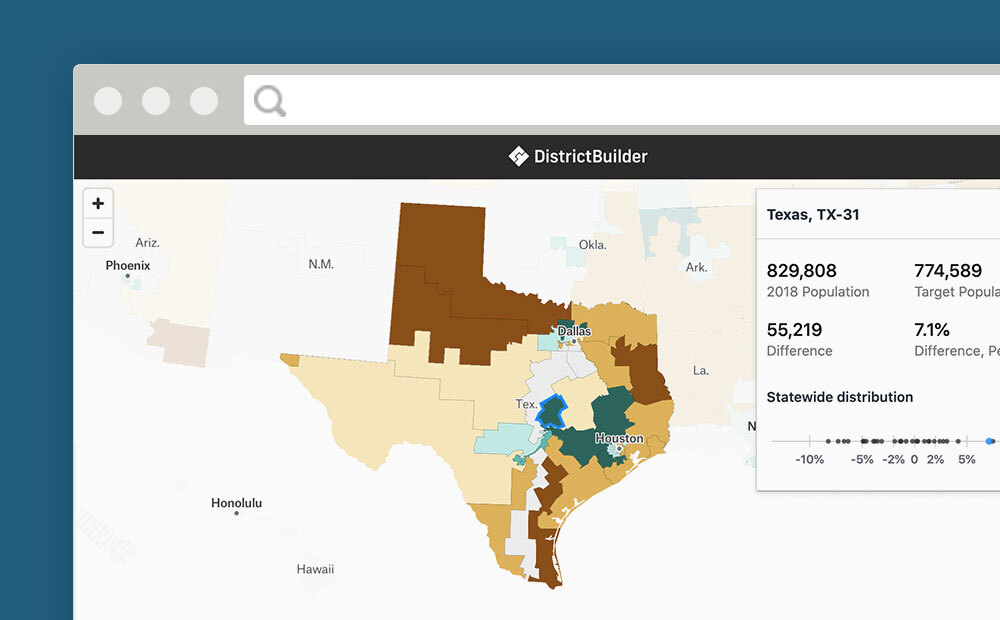
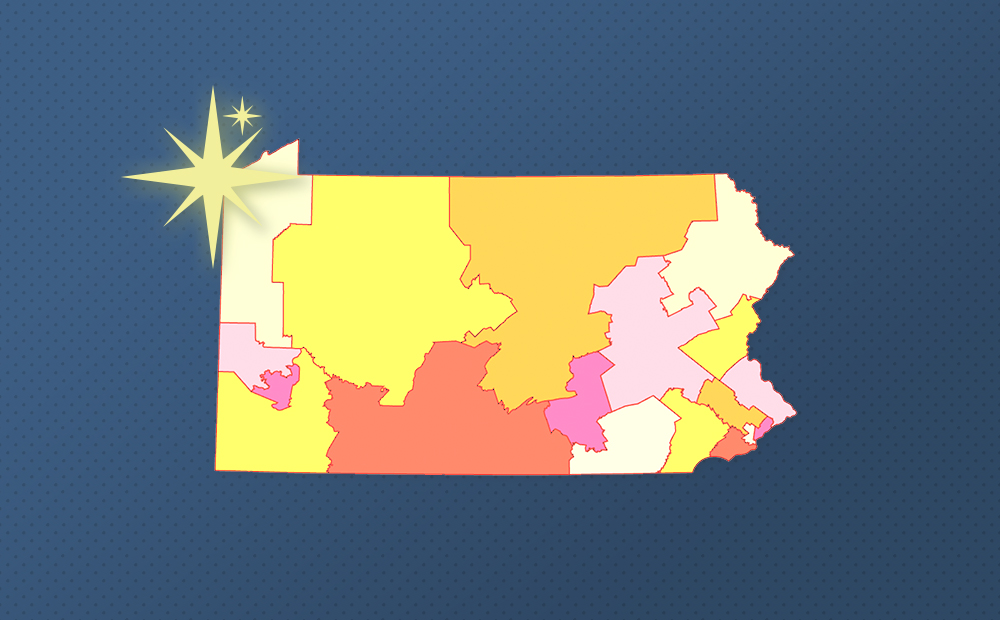
Which Congressional Districts are Over and Under Populated
We calculated which congressional districts have become over or underpopulated since they were last drawn.
Five Strategies for Building a Bootstrapped Product
Without outside investment, we maintain products with limited time and resources. Here are five strategies we use to build successful bootstrapped products.
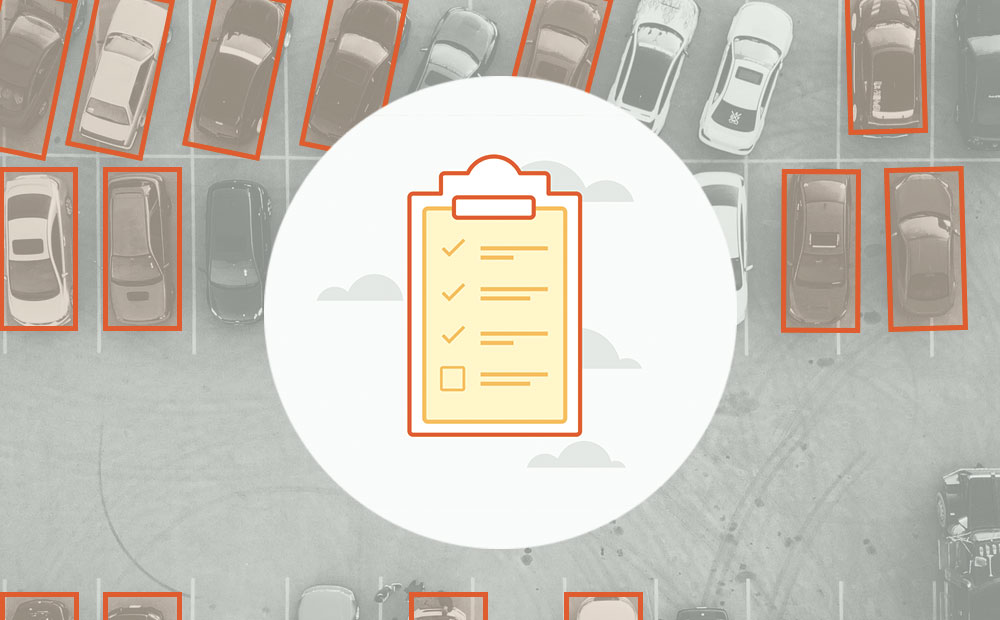
3 Tips to Optimize Your Machine Learning Project for Data Labeling
Mining the knowledge and expertise of your data labeling team will improve the data quality of your machine learning project.
This Month We Learned — June 2020
This month we learned about Google Earth Engine apps, authenticating with the Google Sheets API, and making smaller tiffs for debugging with gdal_calc.py.
Introducing Raster Vision 0.12
We refactored the Raster Vision codebase from the ground up to make it simpler, more consistent, and more flexible. Check out Raster Vision 0.12.
Maintaining Data on the Curb with CurbLR: A New Open Standard
Visualize curb management and its affect on traffic with CurbLR, a promising new open data specification for curb regulation.
This Month We Learned — May 2020
This month we learned about effective pair programming, gdal2tiles, adding ways to OpenStreetMap with GPS traces, and how to make nubes.
SpaceNet Data Now Available in GroundWork
Incorporate high-resolution satellite imagery into your labeling projects for free. Gain new insight from urban satellite imagery data analysis.
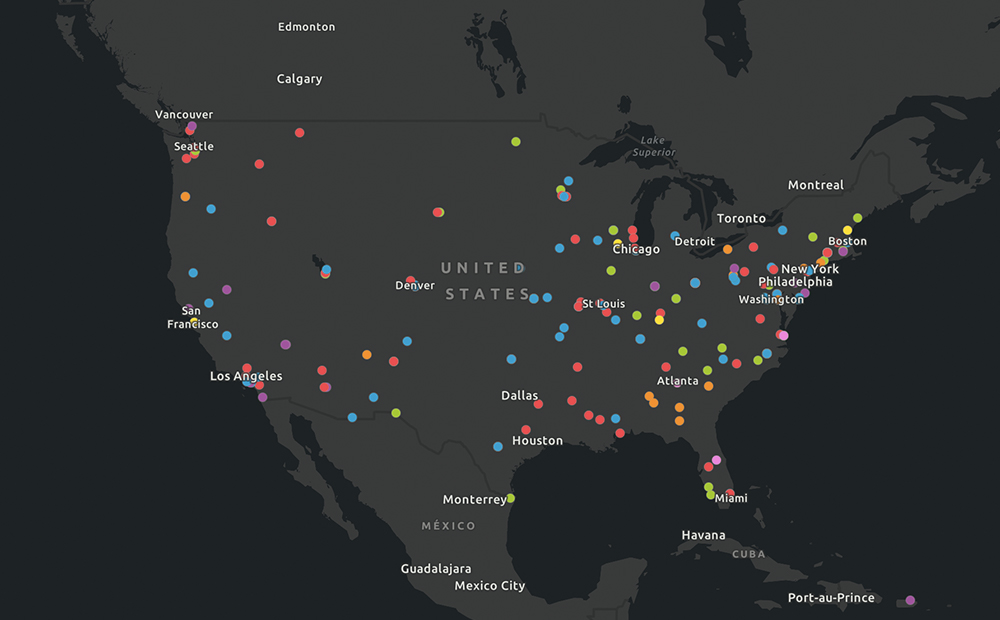
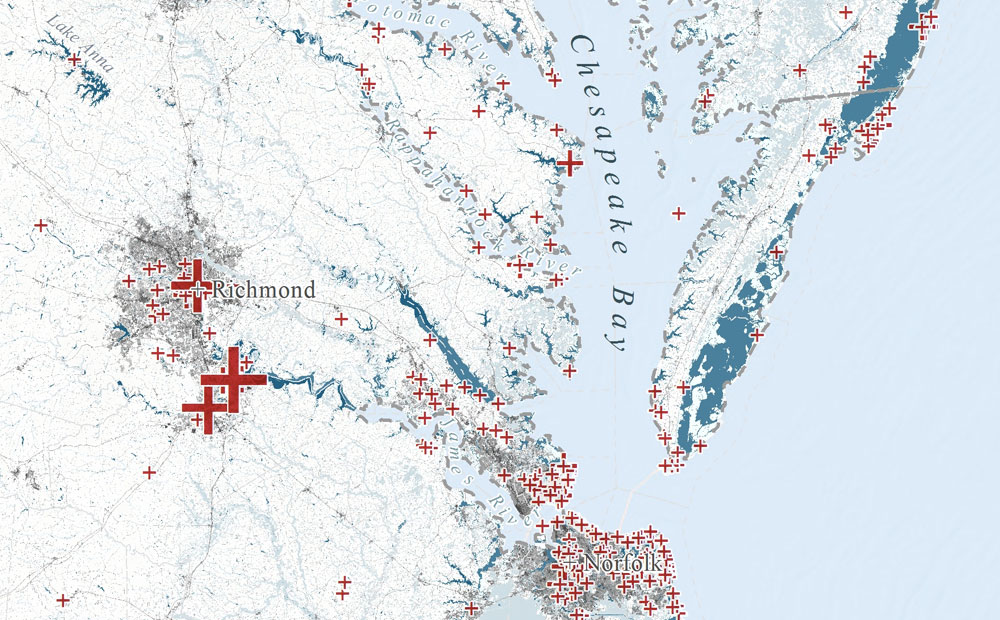
How We Built a National Hospital Dataset for Coronavirus Relief
We pulled data from disparate hospital data sources to create a comprehensive national dataset of the hospital system for the COVID-19 response.
Image Classification Labeling: Single Class versus Multiple Class Projects
When labeling for image classification is it faster to complete projects with single or multiple classes? We ran an experiment to find out.
Black Lives Matter
Black Lives Matter. Azavea stands in solidarity with the Black community in the fight against racism, injustice, and police brutality.
This Month We Learned — April 2020
This month we learned about the PostgreSQL citext extension, fast time-series visualization with vector tiles, and pushing refinement types into a database.
Notifications over Websockets with Http4s and Skunk
Is it possible to service asynchronous notifications over websockets using only PostgreSQL and Scala? We explore in this R&D project.
Revisiting the Ethics of Project Selection
As our work with Earth observation data increased, we developed a new project selection guideline around working with Big Energy.
What A Delay in the U.S. Census Means for Elections and Redistricting
The census has asked to delay delivery of data. What will that mean for redistricting and elections?
This Month We Learned — March 2020
This month we learned about multi-stage builds with Docker, PostgreSQL triggers, and variance analysis.
Create Your Climate Vulnerability Assessment in 7 Steps
Create your Global Covenant of Mayors-compliant climate vulnerability assessment in just 7 steps. Temperate demystifies the vulnerability assessment.
Can AI Reduce Harm to Children?: Gabriel Fernandez and the Case for Machine Learning
Could AI have saved Gabriel Fernandez’s life? Data and social scientists argue that machine learning might have kept him alive.
Labeling Satellite Imagery for Machine Learning
Definitions and visuals of the most common ways to label satellite imagery for machine learning. Includes tips for managing annotations for each type.
This Month We Learned – February 2020
This month we learned about style variation, handling too-big-for-memory data with Dask, and designing solutions with long-term objectives in mind.
Local Redistricting is Transforming California Cities
Redistricting is happening across cities in California in an effort to make representation more equitable. View our map to see where this is happening.
U.S. Officials Who Left Office in 2019 and Why
Who left office in 2019? Why? The Cicero Data team mapped the U.S. officials who left office before the end of their term in 2019.
This Month We Learned – January 2020
This Month We Learned (TMWL) is a recurring series sharing small things that Azaveans learned that month. This month we hear from James, Hector, and Andrew.
The Impact of Becoming a B Corporation
What is a B Corporation, what are the challenges and benefits of becoming one, and what impact are they having on the world?
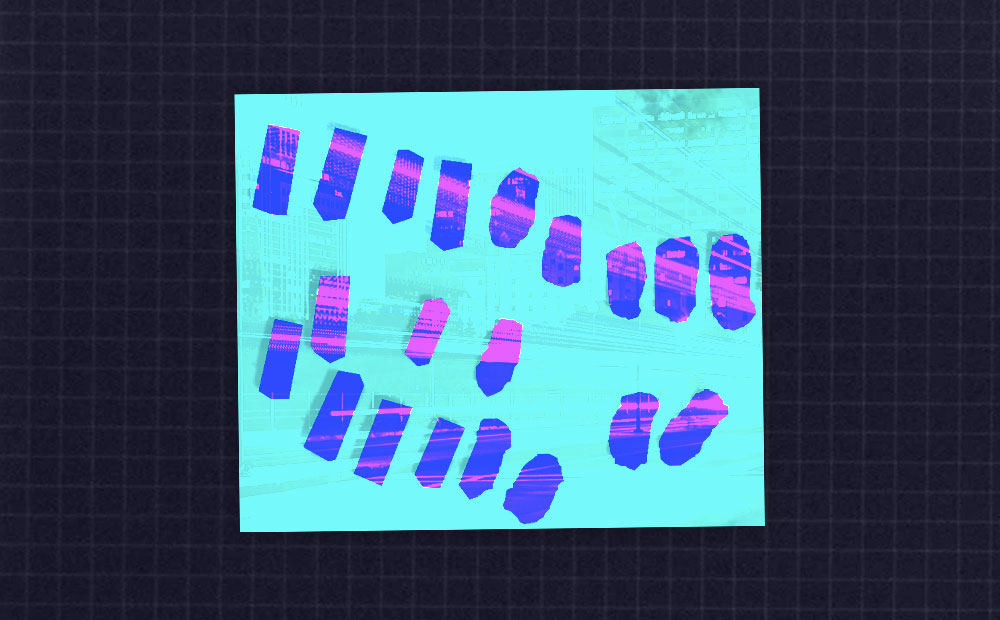
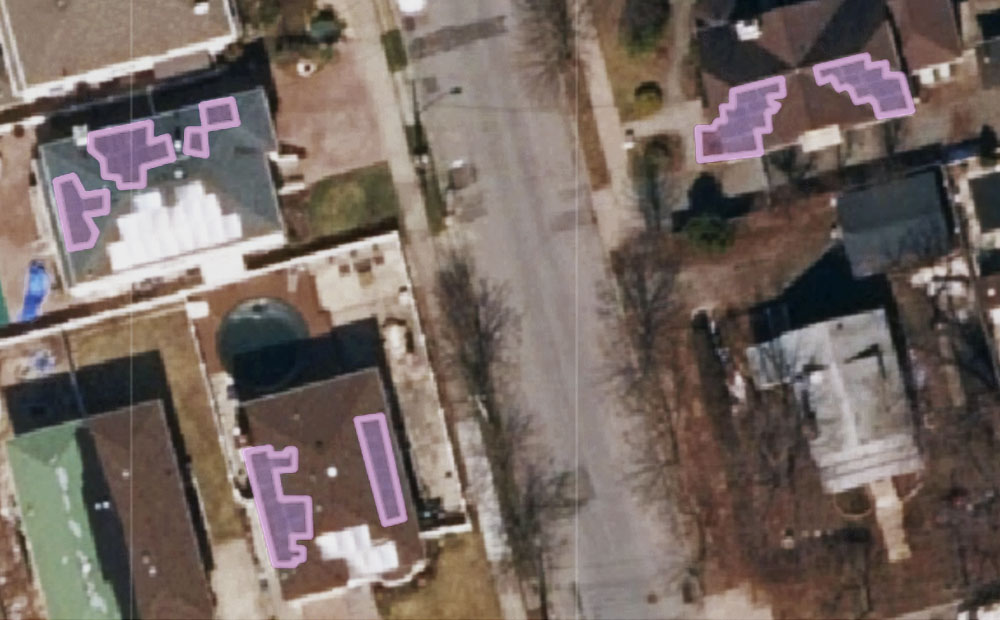
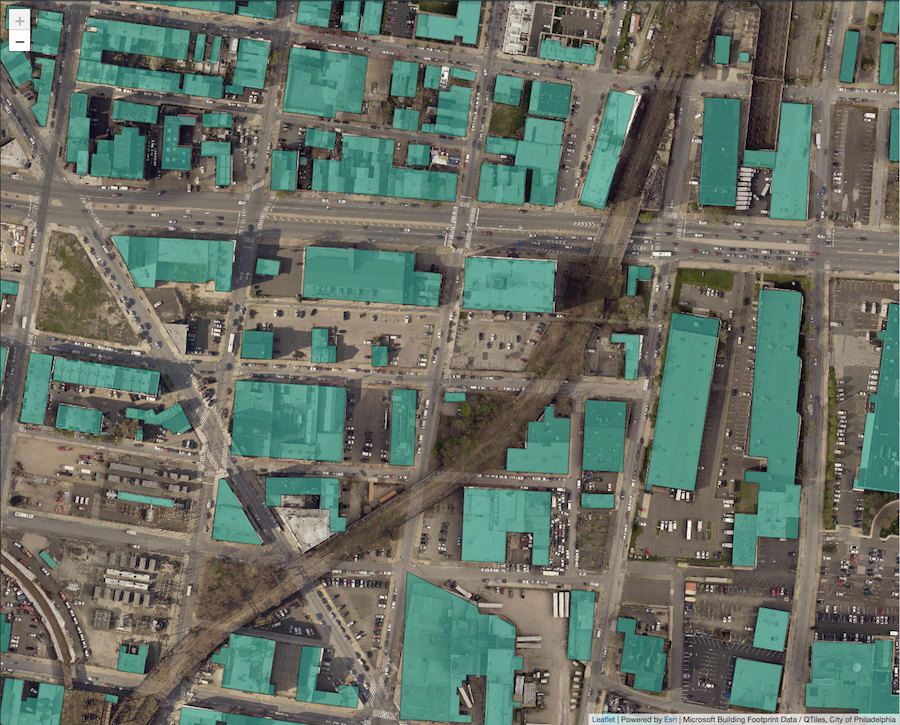
America’s Cities are Sitting on a Gold Mine of Machine Learning Training Data
By nature of collecting and maintaining various datasets, cities are sitting on a treasure trove of machine learning-ready training data.
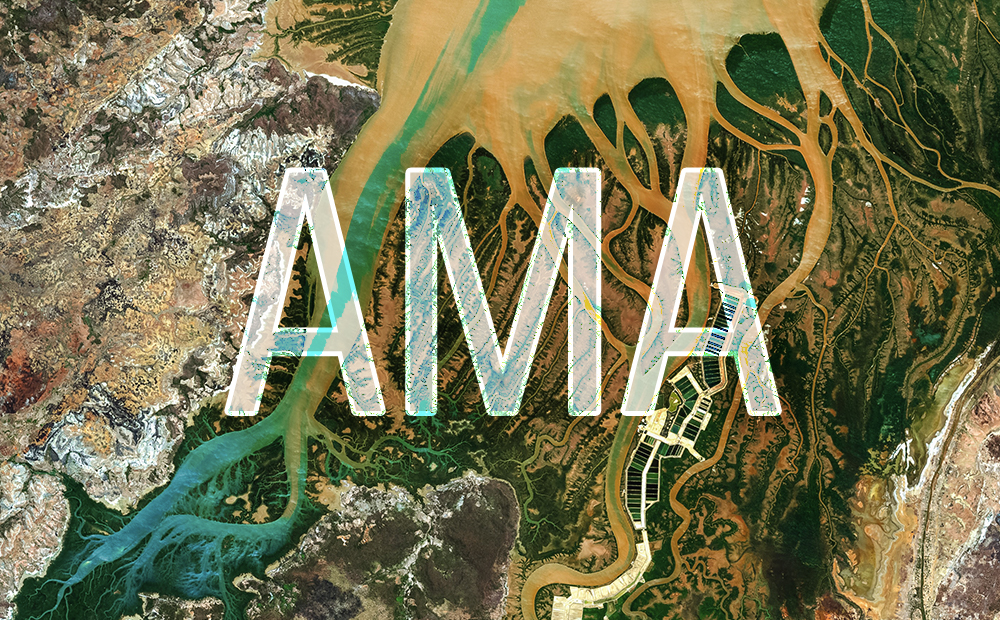
The Future of Machine Learning AMA
Three machine learning engineers answer reader-submitted questions about the future of machine learning applied to geospatial problems.
Getting Started in Machine Learning AMA
Three machine learning engineers answer reader-submitted questions about getting started in geospatial machine learning.
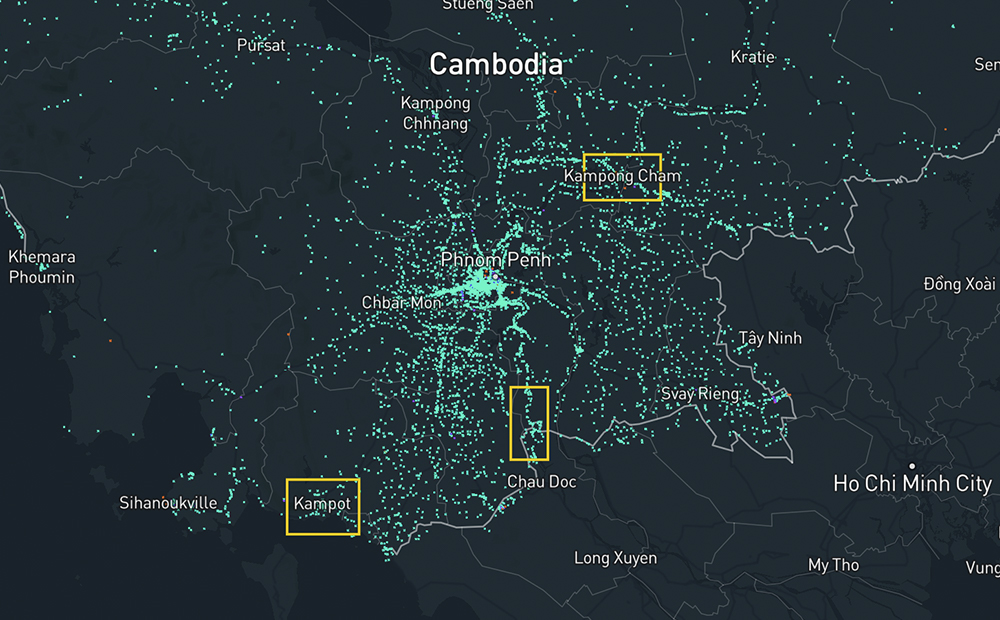
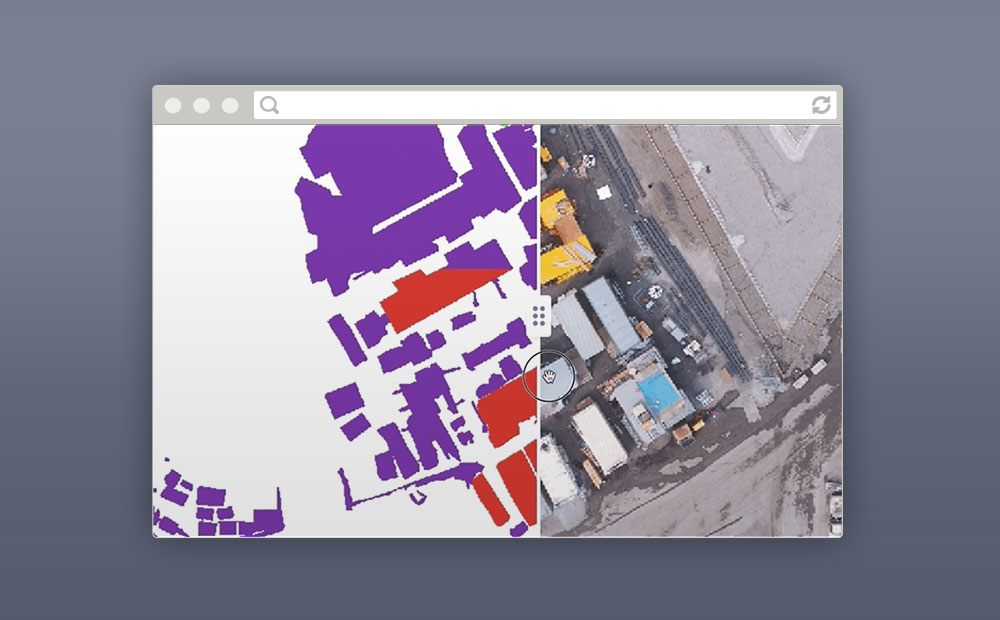
Building Footprint Comparison in Cambodia: Orbital Insight and OpenStreetMap
We created a map that shows the difference between two building footprint datasets of Cambodia: OSM and Orbital Insights' AI generated dataset.
How Geospatial Technology and AI are Transforming Medicine
From predicting outbreaks of infectious disease to predicting the likelihood of an asthma attack, Geospatial AI and medicine are transforming healthcare.
Join the OpenCities AI Challenge and Detect Building Footprints from Aerial Imagery
We helped develop the Open Cities AI Challenge, which uses machine learning to extract building footprints in unmapped areas to promote disaster resilience.
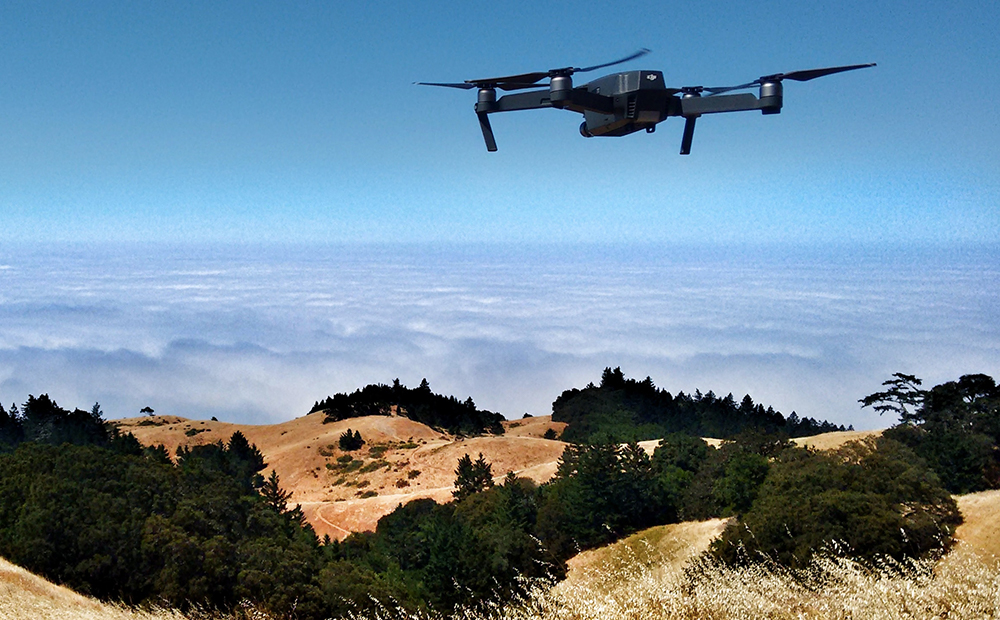
How to Find the Most Recent Satellite Imagery Anywhere on Earth
Every satellite imagery project requires data. Here's how to find the most recent satellite imagery options, considering cost, usability, and resolution.
Calculating Rural Road Access Globally Using Open Datasets
We used three open datasets and the Rural Access Indicator (RAI) to calculate the number of people in the world who do not have sufficient access to a road.
5 Ways to Make Your Office Event More Inclusive
Our workforce is more diverse than ever. Follow this five-step guide to consider various colleague needs and plan more inclusive office events.
Committees at Azavea
What are our committees and what do they do? Hear from Robert and Azaveans what each of our committees are and why they matter.
Three Ways to Get Into the “Mind” of a Supervised Machine Learning Model
Using a tool to compare model predictions to training data and doing some labeling yourself can help you understand your supervised machine learning model.
3 Ways to Analyze the Results of a Supervised Machine Learning Model
Modeling State with TypeScript
Working with frontend state can be challenging. With TypeScript, application logic can be encoded in types to ensure data correctness and prevent bugs.
Ethical Machine Learning for Disaster Relief: Rage for Machine Learning
Predicition is driving a rage for deep learning in crisis management and disaster relief. How can these powers be harnessed for ethical machine learning?
Expanding Leadership Opportunities with Committees
We developed a committee system in 2016 to provide leadership opportunities for all of our colleagues and to enhance our work space.
Without Local News, I Can’t Do My Job
The availability of local news is declining nationwide. This post discusses the impact the lack of local election results may have on civic engagement.
10 Years into Azavea’s Charitable Contributions Program
Ten years ago we started a charitable contributions program. We developed a program that would increase our impact and expand employee ownership.
Ethical Machine Learning for Disaster Relief: Avoiding the Second Disaster
Machine learning on satellite imagery is revolutionizing disaster relief. What does ethical machine learning look like for the field?
Betting Big on the Spatiotemporal Asset Catalog (STAC) Standard
We're investing heavily in the STAC specification, hoping to accelerate adoption across the geospatial engineering community more broadly.
An Introduction to Satellite Imagery and Machine Learning
Today, the availability of satellite imagery still far outpaces our capacity to analyze it, but machine learning and tools like Raster Vision are helping.
Introducing PySTAC: A Core Library for SpatioTemporal Asset Catalogs
PySTAC is a Python library for reading, writing, and manipulating SpatioTemporal Asset Catalogs. PySTAC 0.3 is now released and ready to use!
GeoTrellis 3.0 Release
GeoTrellis 3.0 includes feature additions and improvements that make it easier to read raster data from a variety of formats and sources, and support COG's.
Azavea and CloudFactory: Partners on Quality Training Data and Social Impact
To increase the impact and scope of our machine learning work, Azavea hired Cloud Factory as an outsourced data labeling partner.
STAC: Creating an Ecosystem of SpatioTemporal Assets
STAC is creating an ecosystem of interoperable spatiotemporal assets. Learn how Azavea has contibuted and about future steps for the specification.
Housing & Landlords: Using Open Data to Find Substandard Conditions
Using R and QGIS to analyze substandard housing in Philadelphia. We used open data to identify violations, evictions, and illegal rentals.
Is This a Crosswalk?: 5 Takeaways from Training a Data Labeling Team
Tips for training remote workers in data labeling for machine learning projects.
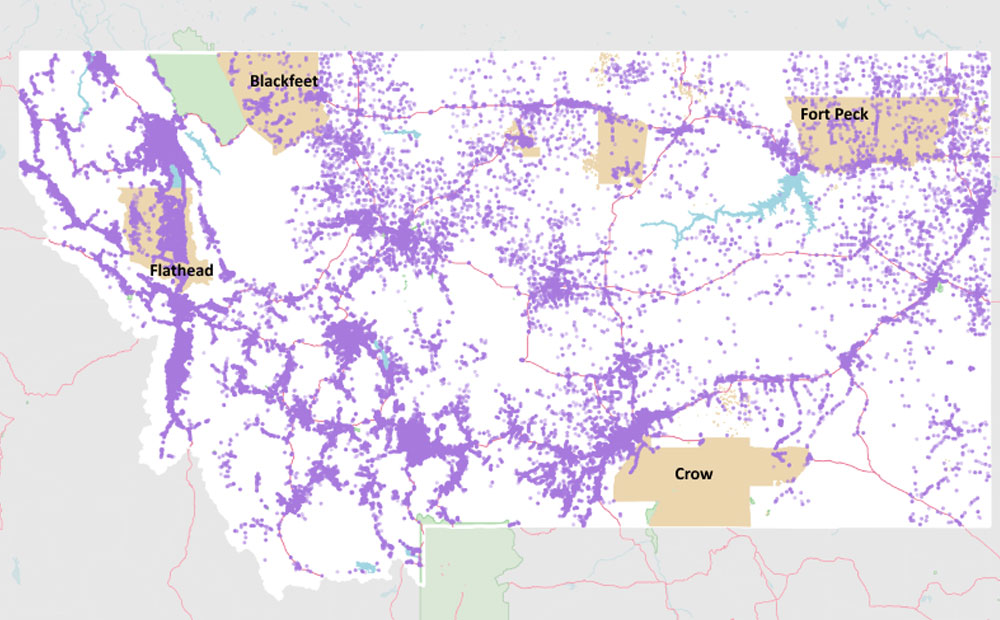
Putting Native American Voters on the Map: Using Cadastral Data to Geocode Non-Traditional Addresses
We used cadastral land survey data to geocode previously unmappable Native American voters in Montana.
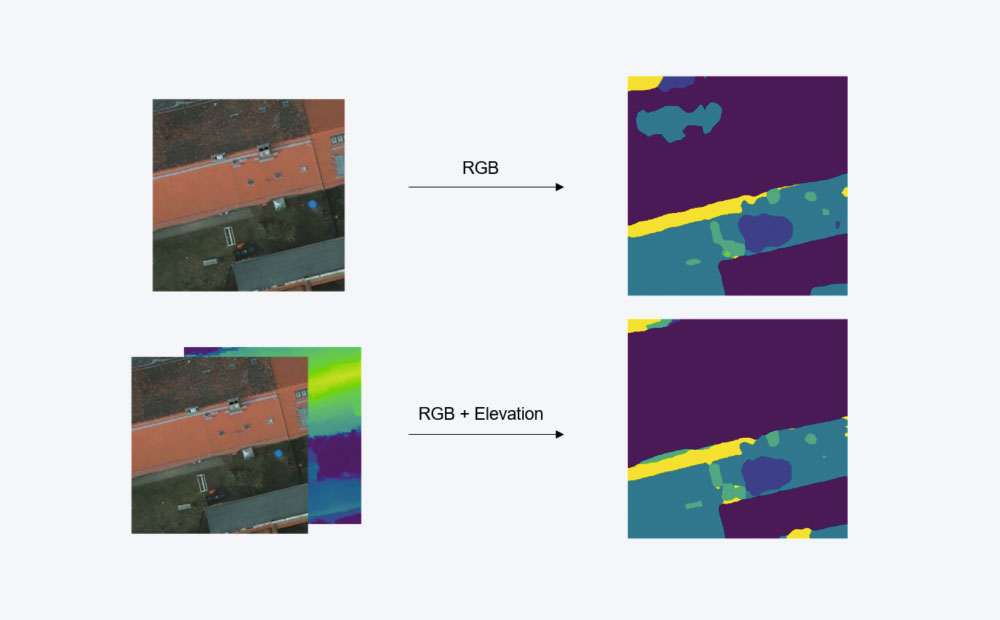
Transfer Learning from RGB to Multi-band Imagery
Use transfer learning to teach a model to take advantage of multi-band imagery without discarding the original RGB pre-training.
Using the Dedupe Machine Learning Library for Cleaning and Matching Data
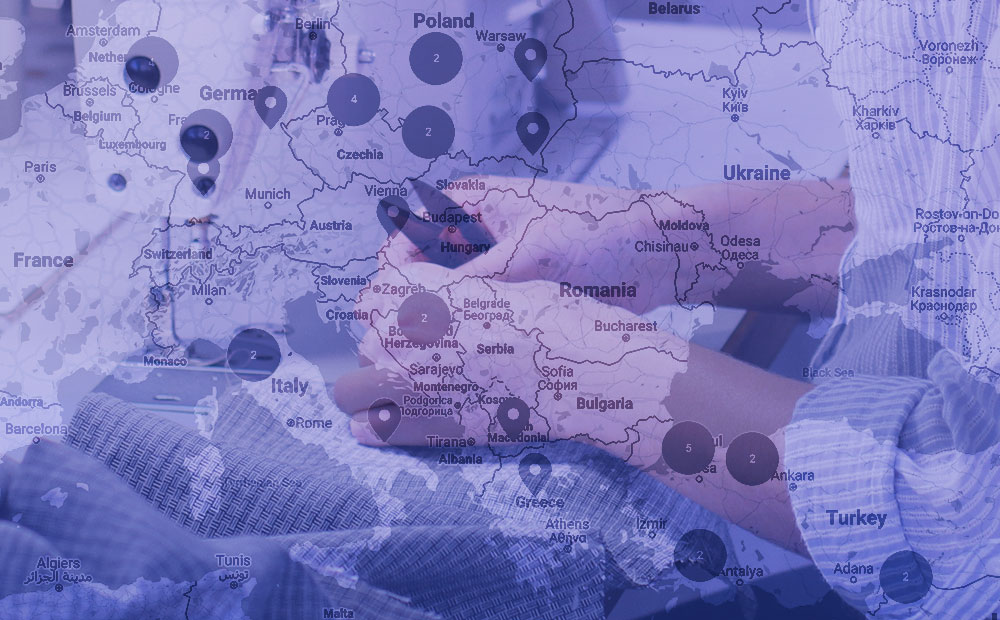
Learn how Azavea uses the Dedupe machine learning library to overcome the challenge of linking apparel facilities in the Open Apparel Registry.
Temperate Takes a Rural Approach
To incorporate the 97% of America's lands that are designated as rural, Temperate will soon focus on climate adaptation planning for rural areas.
Connecting Data and People with the Open Apparel Registry
As the number of facilities increases, the Open Apparel Registry improves data within the apparel industry and impacts the lives of garment workers.
Using Noisy Labels to Train Deep Learning Models on Satellite Imagery
We measured the relationship between noisy labels and model accuracy by training a semantic segmentation model with labels extracted from Open Street Map.
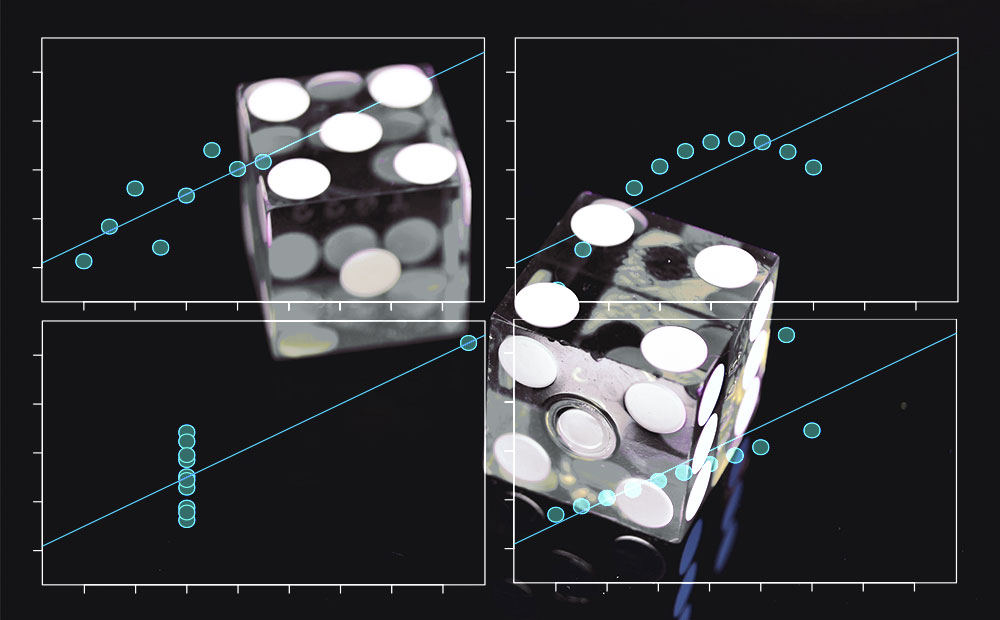
Lies, Damned Lies, and Accuracy Metrics
There are many ways to measure the performance of machine learning models. How accurate can you make them? It depends on how we decide to define accuracy.
Exploring the Urban-Rural Divide through Politicians’ Social Media
Using US Census data and the Cicero API, we examine how elected officials are using social media and what that says about the urban-rural divide.
The Scooters Are Coming: let’s require data this time
The integration of rideshare and dockless scooters into our transportation systems is an opportunity to develop open standards and demand open data.
Introducing WMS and WCS Support for GeoTrellis and Raster Foundry
Raster Foundry and GeoTrellis now support WMS and WCS standards, enabling streamlined workflows that utilize multiple data sources.
Trends in Local Elections in 2019
We tracked almost 60 local elections happening throughout the U.S. since March. We discuss partisan trends and elected official turnover rates.
Start-Stop-Continue: One Way That We Solicit Feedback
Employee feedback makes our office space and practices better. We implemented Start-Stop-Continue in 2011 to solicit robust and anonymous employee feedback.
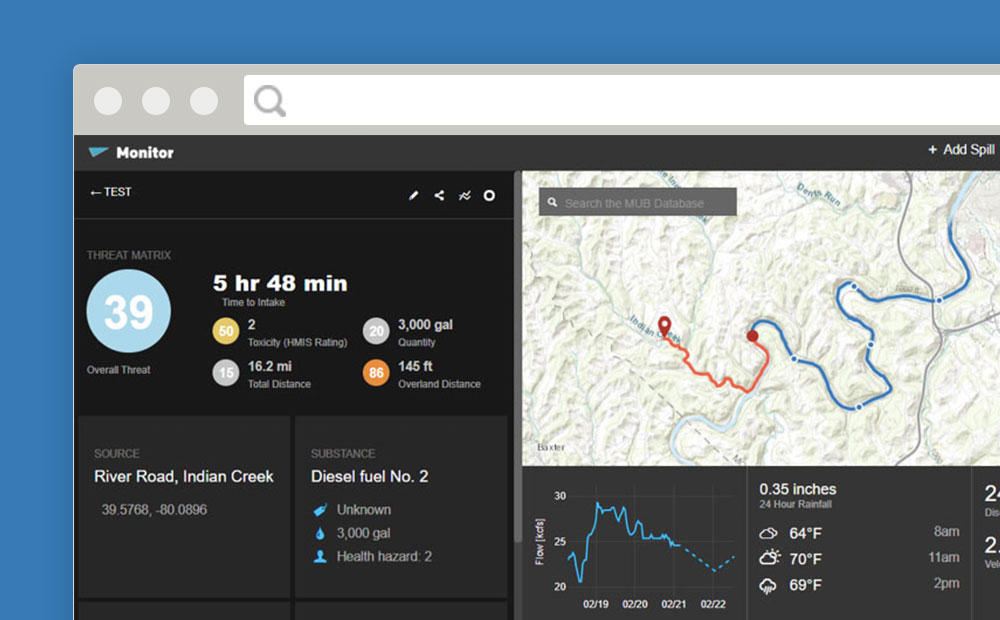
MUB Monitor: Helping Water Utilities Track and Respond to Upstream Threats
We created MUB Monitor, a comprehensive GIS-based tool, to help water professionals track spills, assess watershed threats, and make informed decisions.
5 Ways Company Leaders can Support New Parents in the Workforce
Supporing working parents means retaining top talent. Here are 5 ways companies can make the transition back to work smoother for parents in the workforce.
Developing Countries, Capacity Building, and SDGs
In utilizing earth imagery to achieve all 17 UN SDGs, we must invest in capacity building of developing countries to build sustainable solutions.
Lessons in Functional API Development from Haskell’s Servant and Http4s
We replicated a small piece of the Raster Foundry code in Haskell, using servant for the REST interface and postgresql-simple for database interaction.
Make an Election Calendar with D3.js
We made a quick election calendar using the Cicero database and Observable Notebooks. This tutorial shows how you can replicate using D3.js.
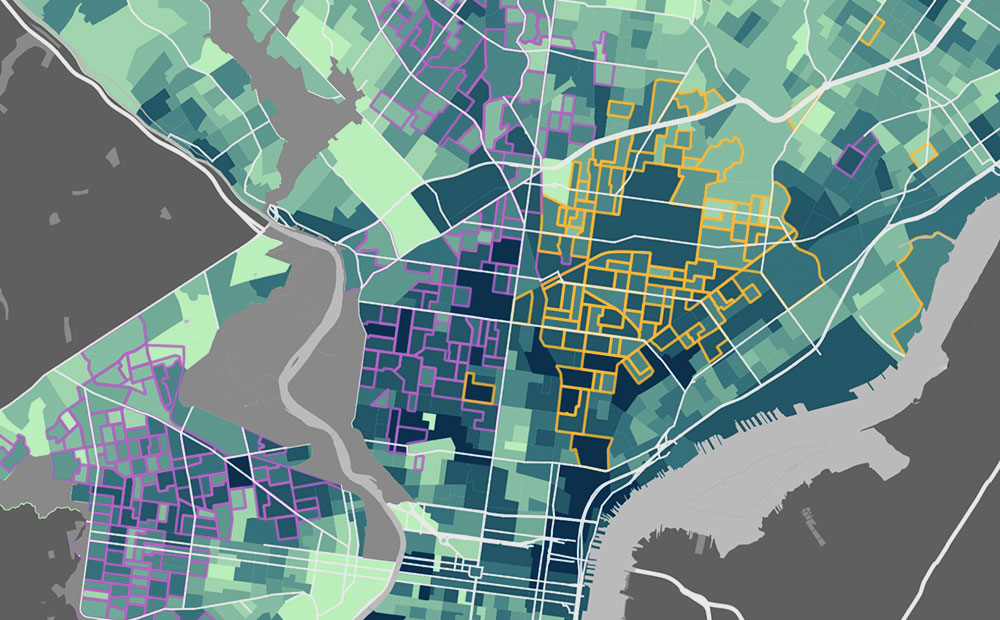
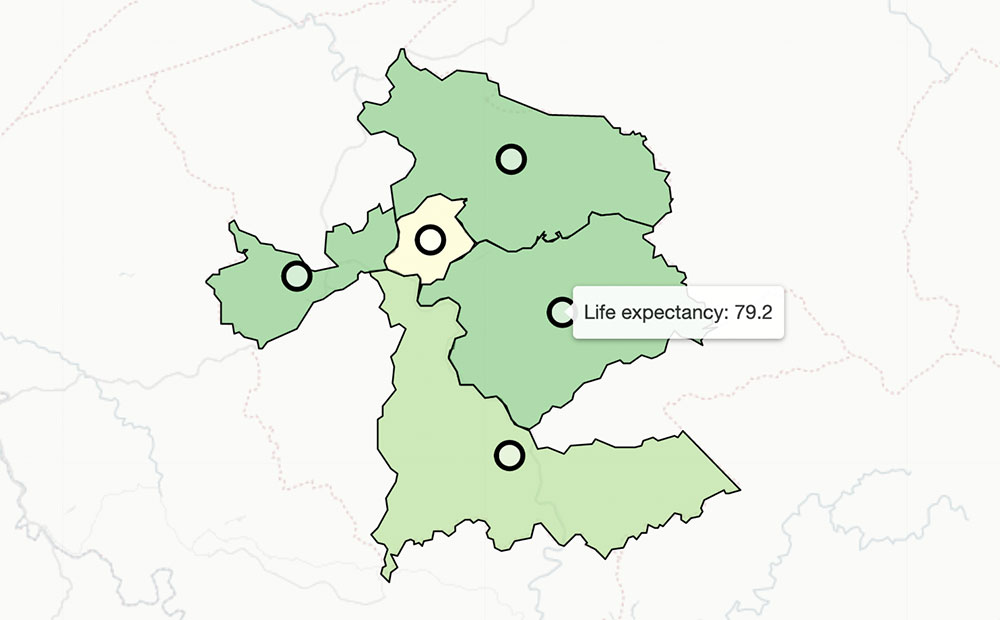
Analyzing Spatial Patterns in Life Expectancy with Python
All around the country boundaries separate neighborhoods with high and low life expectancy. We used python to find the most extreme examples.
Access Local Elected Official Data for Canadian Cities
Access contact information for local Canadian elected officials. Address to electoral district matching for the largest Canadian cities.
Using Cloud-Optimized GeoTIFFs (COGs) for More Efficient Web App Architecture
Cloud-Optimized GeoTIFFs (COGs) are geoTIFFs hosted on a cloud or file server, and are optimized for remote reads. They proved useful in a recent project.
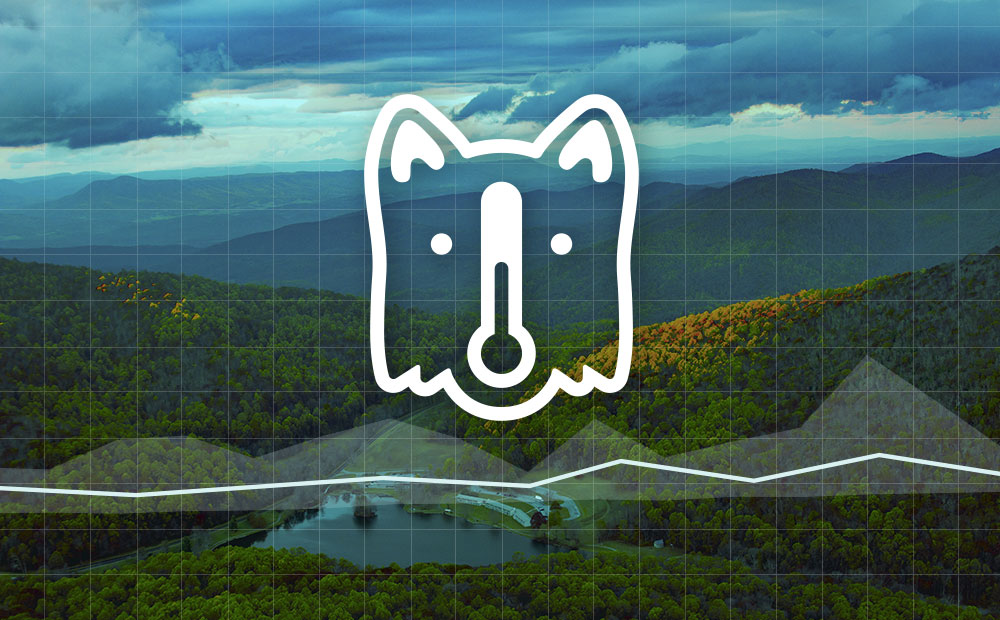
Blacksburg, VA Finds Their “TurboTax™ for Climate Vulnerability Assessments” in Temperate
This case study showcases how Temperate is uniquely poised to walk cities through the confusing process of conducting a climate vulnerability assessment.
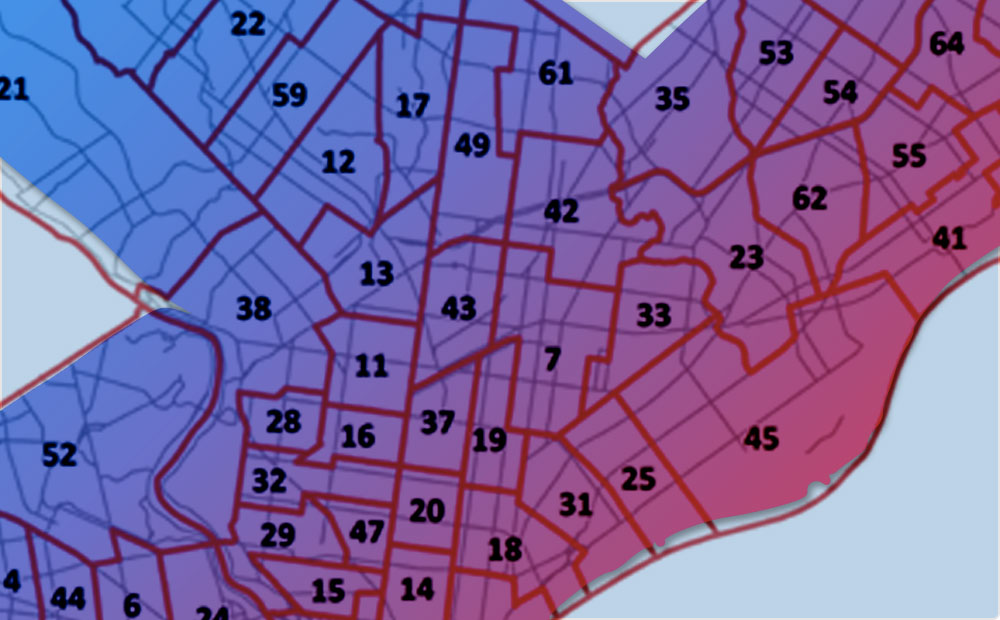
Scoring Philadelphia’s City Council Districts for Children’s Health and Well-being
Scoring Philadelphia City Council districts on assets and risks using a weighted spatial analysis model in R and Python.
Raster Vision 0.9 Release Candidate
This release of Raster Vision includes bug fixes, an easier setup, improved performance, and the ability to train models off of labels in OSM.
Aster Vision – A New Open Source Framework for Deep Learning on Astrospatial Imagery and Space Exploration
Aster Vision is an open source machine learning library for analyzing huge troves of astrospatial data and finding habitable planets around nearby stars.
Introducing the Open Apparel Registry
We are excited to announce the launch of the Open Apparel Registry, an open source global map of garment producing facilities.
The Power of Types in Idris
Explore type-driven development and interactive editing in Idris, a pure functional language with a powerful type system.
Lessons on tree-shaking Lodash with Webpack and Babel
Tree-shaking lodash can reduce the size of your JavaScript bundle, but it requires that a few conditions are met along the way to implementing it.
5 Tips to Making The Most of It at An Activist Conference
Last month we attended an activitst conference and learned a few things that we thought might be helpful to others in the political advocacy space.
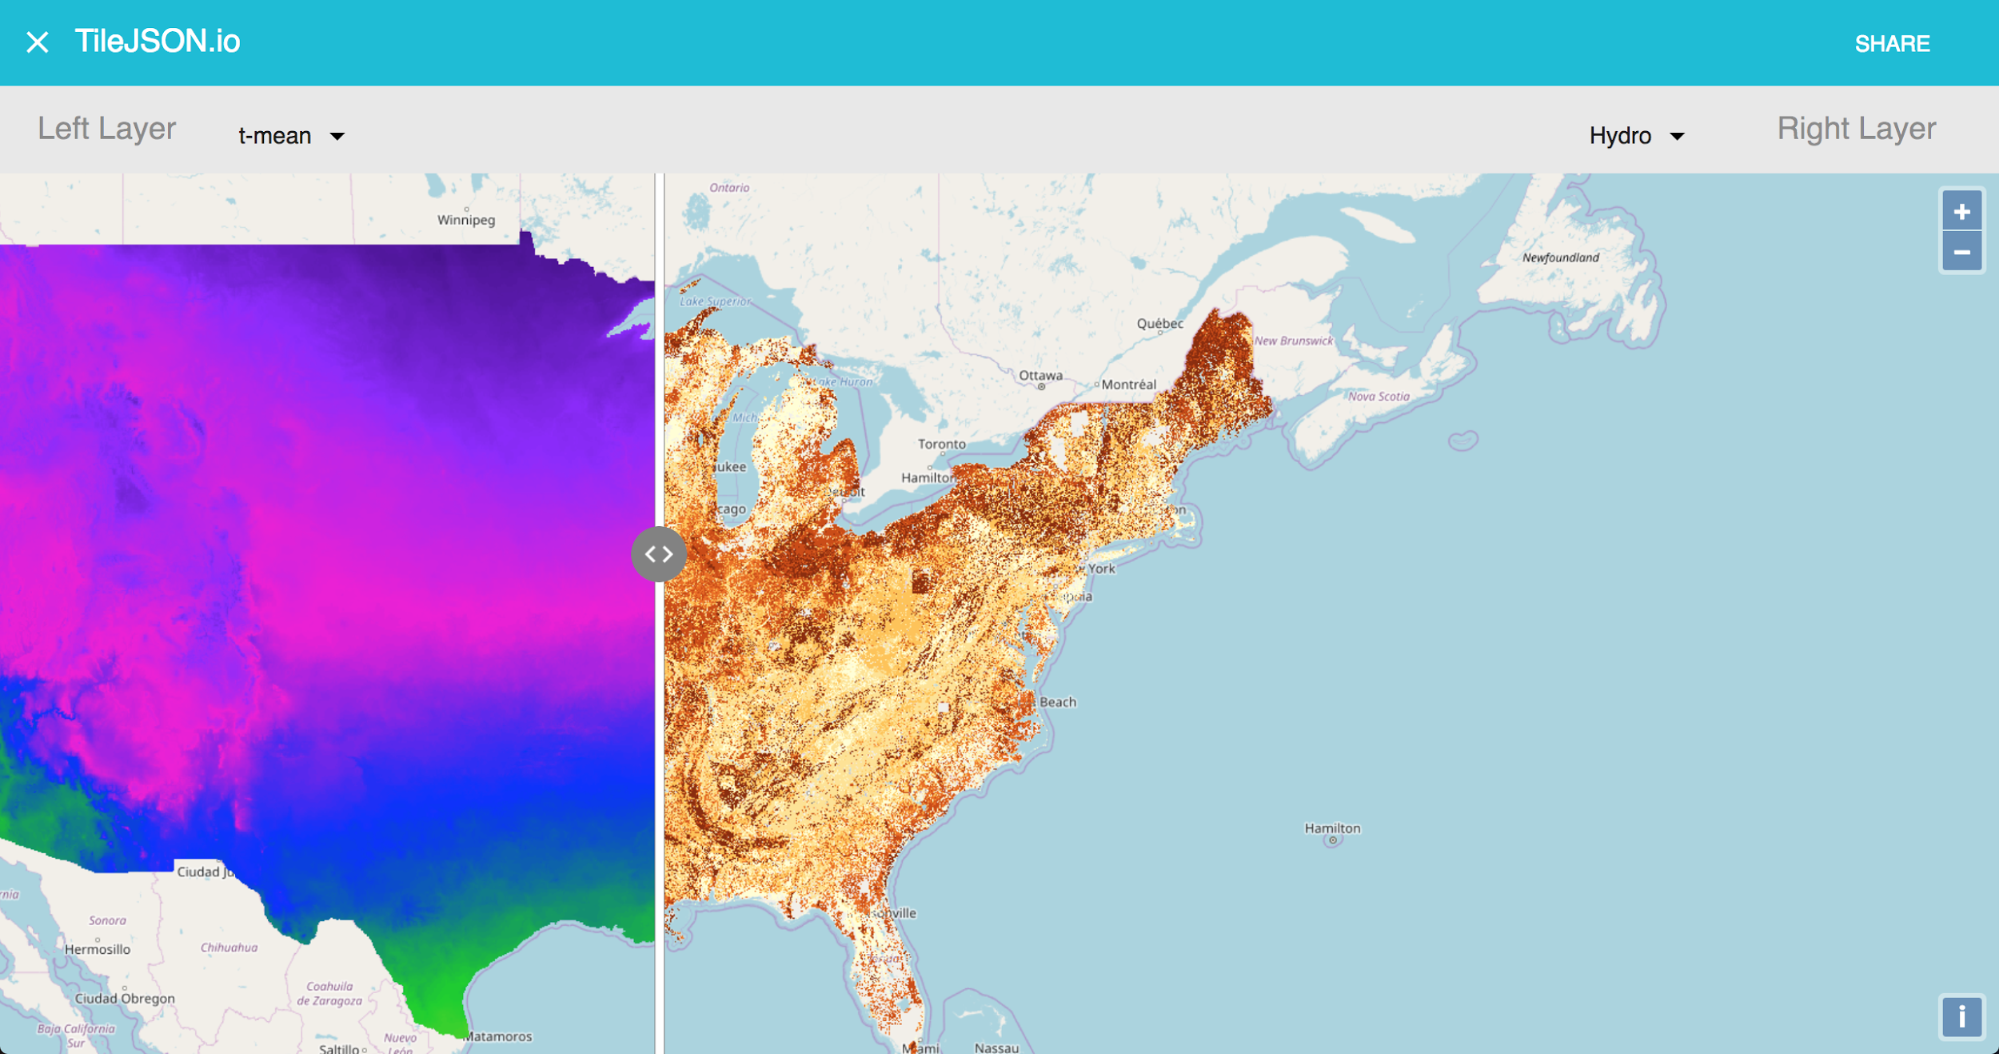
Introducing TileJSON.io, A Fast and Easy Way to View and Share Raster Tiles
TileJSON.io is an open source project by Azavea. It is an easy way to view and share raster tile sets using slippy map endpoints.
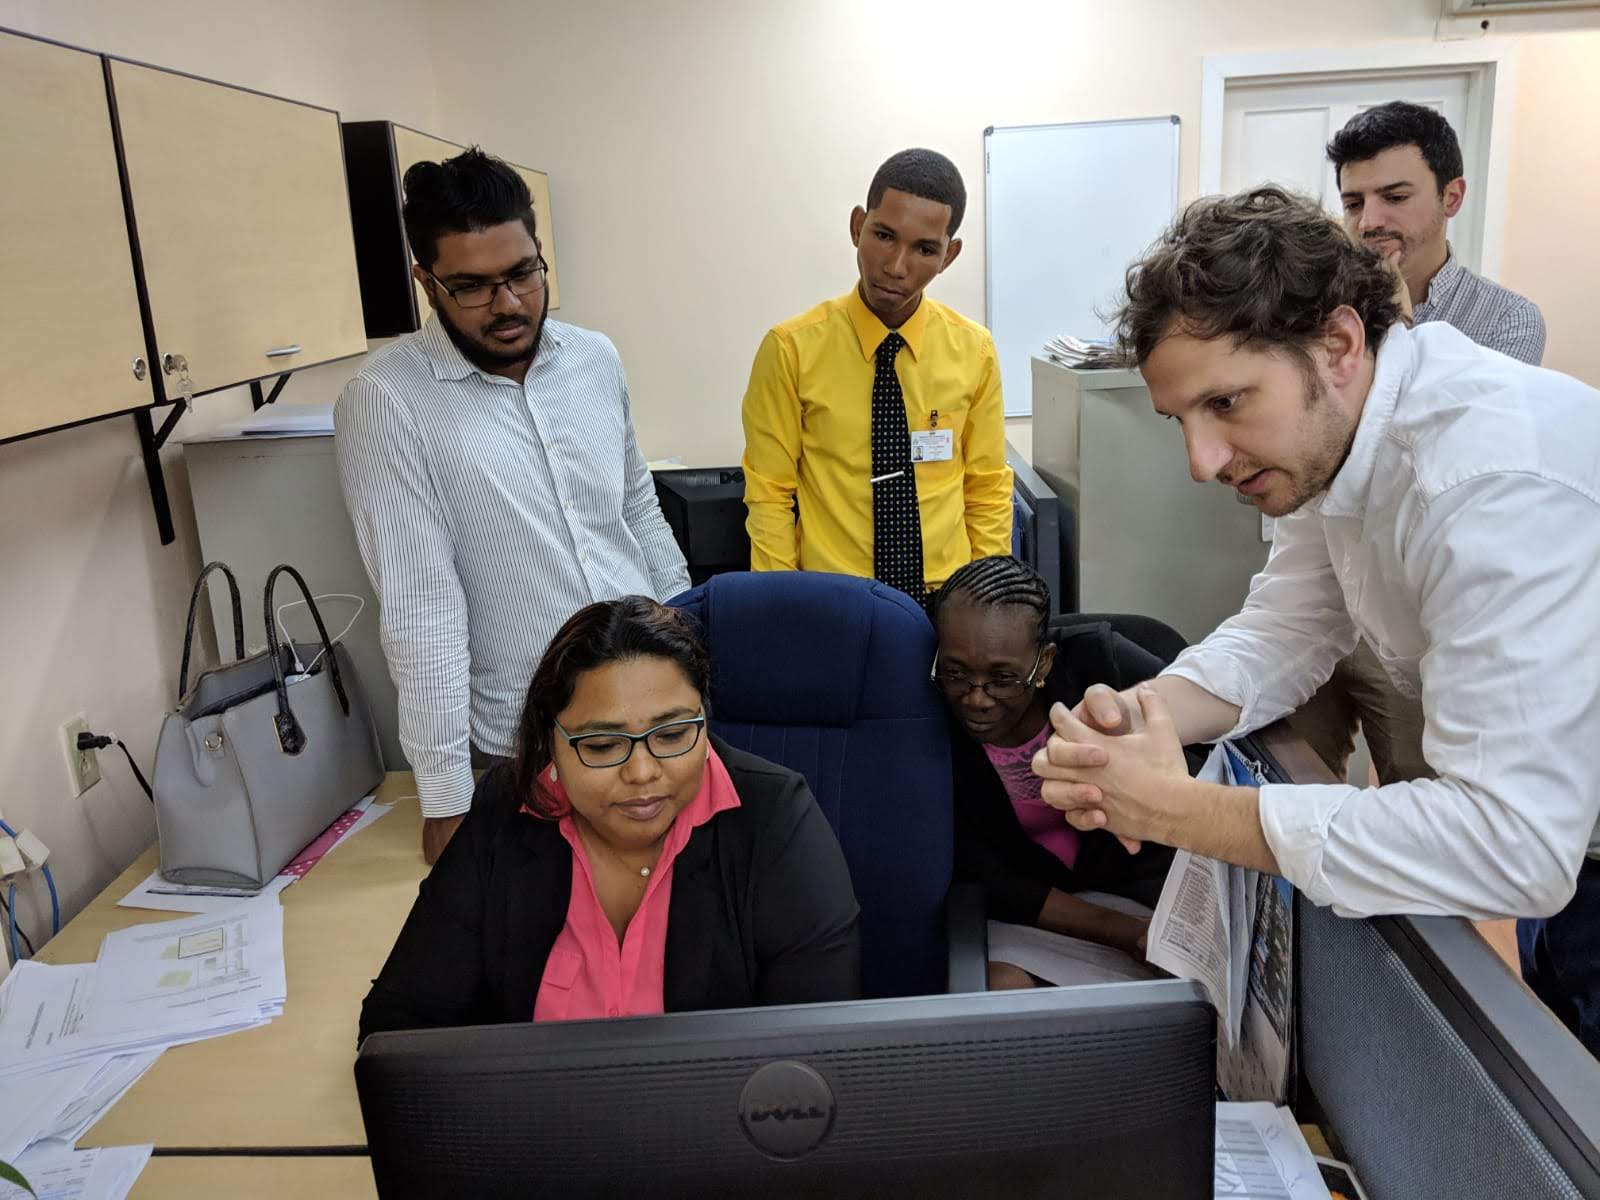
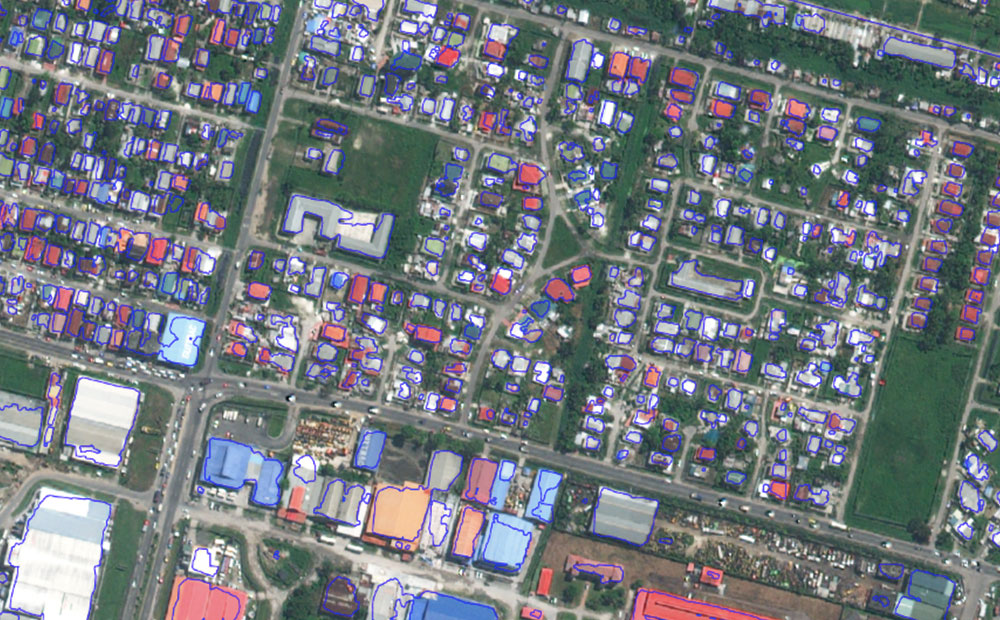
Enhancing GIS Capacity with OpenStreetMap
We're working with the Inter-American Development Bank to improve the GIS capacity of Guyana with tools built to extract OpenStreetMap data.
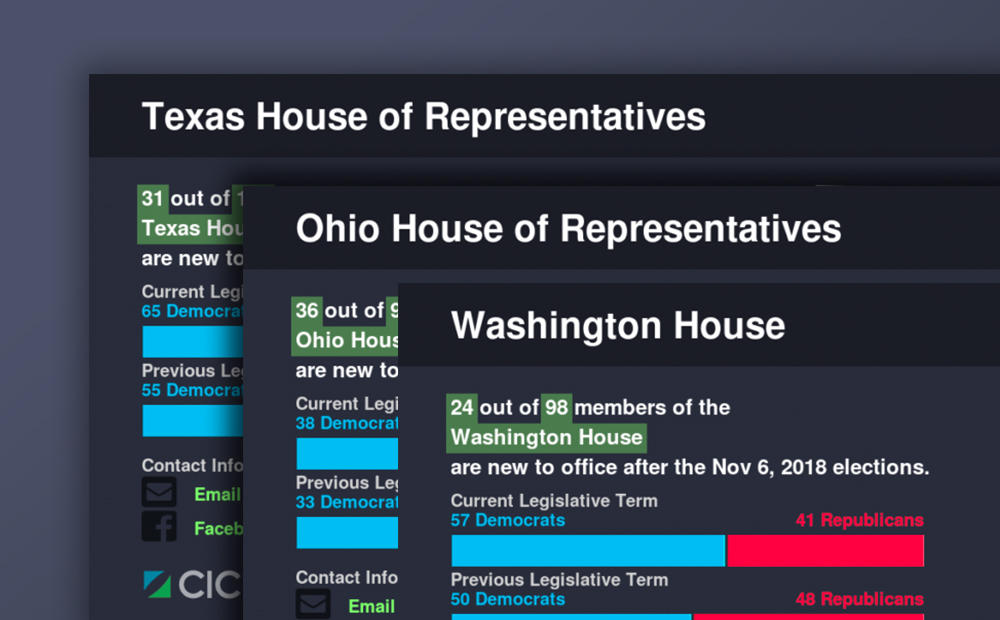
New Elected Officials, Visualized
We gathered elected official data from all across the country after the 2018 U.S. midterm election. We show shifting party structure and contact methods.
Mapping Africa: Crowdsourced Machine Learning
We leveraged our ability to process raster imagery, our open sources libraries, and our knack for machine learning to map agricultural fields in Africa.
Accuracy is in the Eye of the Beholder
Accuracy in deep learning models is not as cut and dry as many present it to be. We examine several examples where accuracy is more of a judgment call.
Here’s a Map of Every State Legislator in 2019
Here’s a map of every state legislator in the U.S. as of February 2019, with districts and elected official data from the Cicero database.
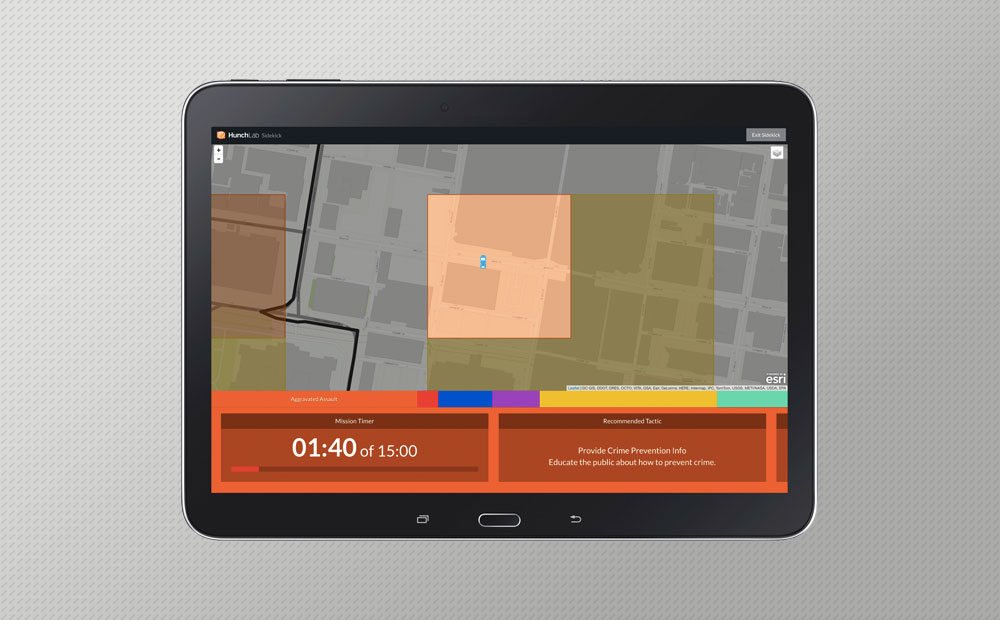
Why We Sold HunchLab
We sold HunchLab, our web-based predictive policing and patrol management system, in the fall of 2018. Our CEO outlines why.
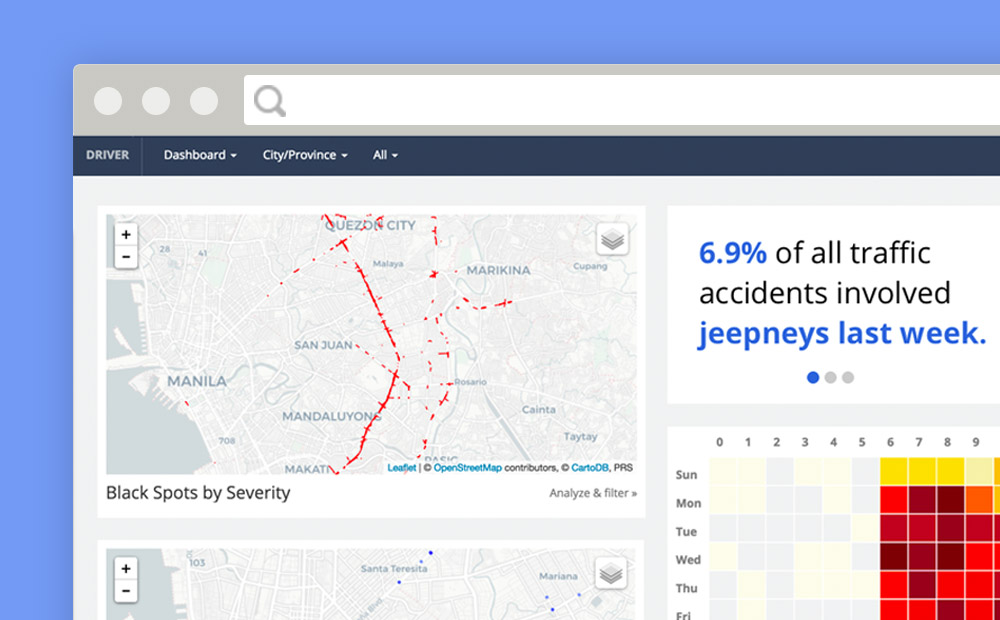
Reducing Road Crashes with DRIVER
DRIVER is the open-source platform created by Azavea with the World Bank to mitigate road crashes through data collection, management, and analysis.
How Azavea Selects Projects
As a mission-based organization, how we select the projects we pursue is an ongoing conversation at Azavea. We share our thought process here.
Giving Form to Temperate’s Identity
Part two of our design process series details how we established Temperate's brand in a saturated industry, with the product's goal driving decision making.
Problem-solving by asking questions
The first in a two-part series, this blog post details how we solved a design problem by asking questions in building our climate adaptation planning app.
AWS Enables Temperate
We recently released Temperate: A new climate adaptation planning companion for cities. This blog explores how AWS, and the data they host, fueled this app.
Six Ways Azavea Funds Innovation
Without outside funding and given our commitment to openly sharing our knowledge, people often ask: How do you fund your innovation? We outline 6 main ways.
Why You Shouldn’t Keep Politics out of the Workplace
More companies are taking their impact on the world into consideration and consumers are paying attention. Can being political be profitable?
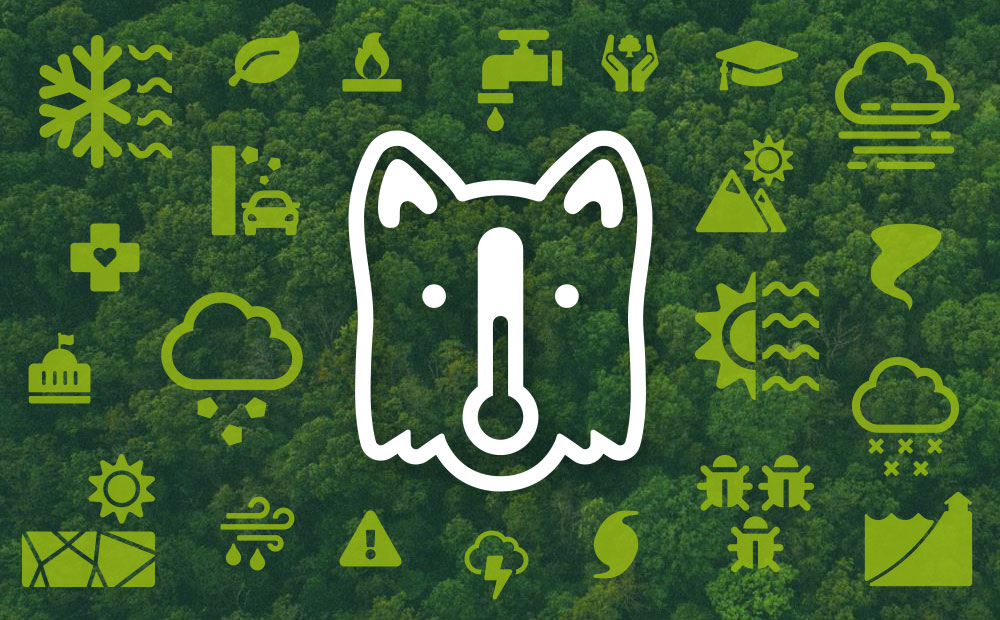
Temperate: Your Climate Adaptation Planning Companion
Azavea rolled out Temperate, a climate adaptation planning app, in 2018. Get the details here.
Reflections from the UN World Data Forum
Azavea attended the UN World Data Forum in Dubai last week and learned how Earth Imagery can be applied to Sustainable Development Goals (SDGs).
Here’s Where Redistricting Means New Districts This Year
Redistricting was rampant in 2018. Over 31 million Americans will be voting in new local, state, or congressional districts on Election Day next week.
What We’re Reading in Advance of the 2018 U.S. Midterm Elections
With the 2018 U.S. midterm elections fast approaching, we thought we would share some interesting election related reading from around the web.
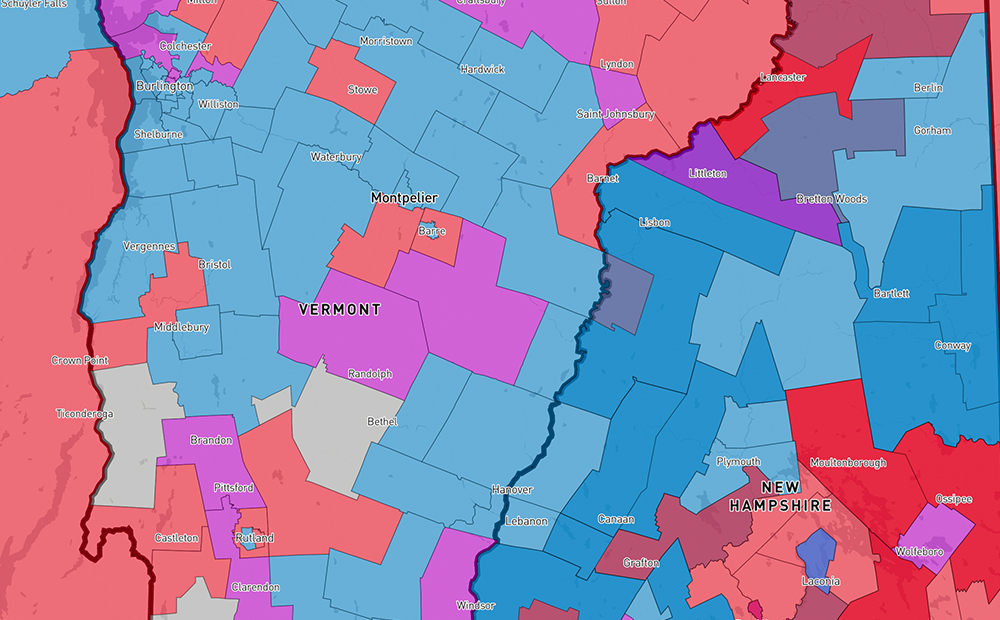
Visualizing Redistricted Legislative Districts
Why we created a free tool to help you find out if your area is redistricting before your next election. Visualize your new legislative districts on a map.
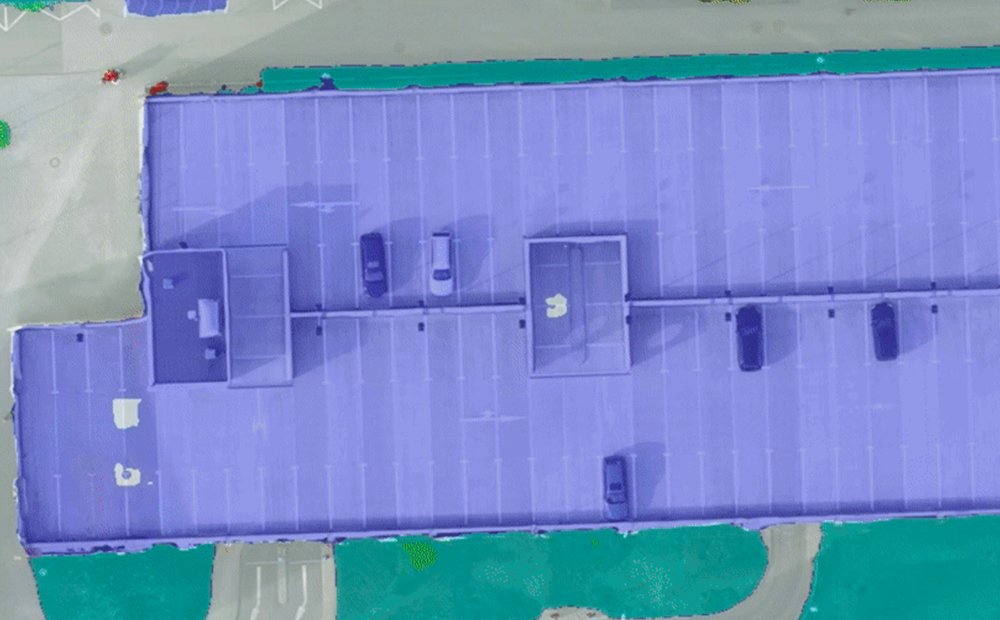
Raster Vision: A New Open Source Framework for Deep Learning on Satellite and Aerial Imagery
Azavea is pleased to announce the release of Raster Vision, a new open source framework for deep learning on satellite and aerial imagery.
Using ArcMap, R, and Adobe Illustrator to Create Data Driven Infographics
Learn to create a series of data-driven infographics in the context of a project that evaluates bus performance in each Philadelphia City Council District.
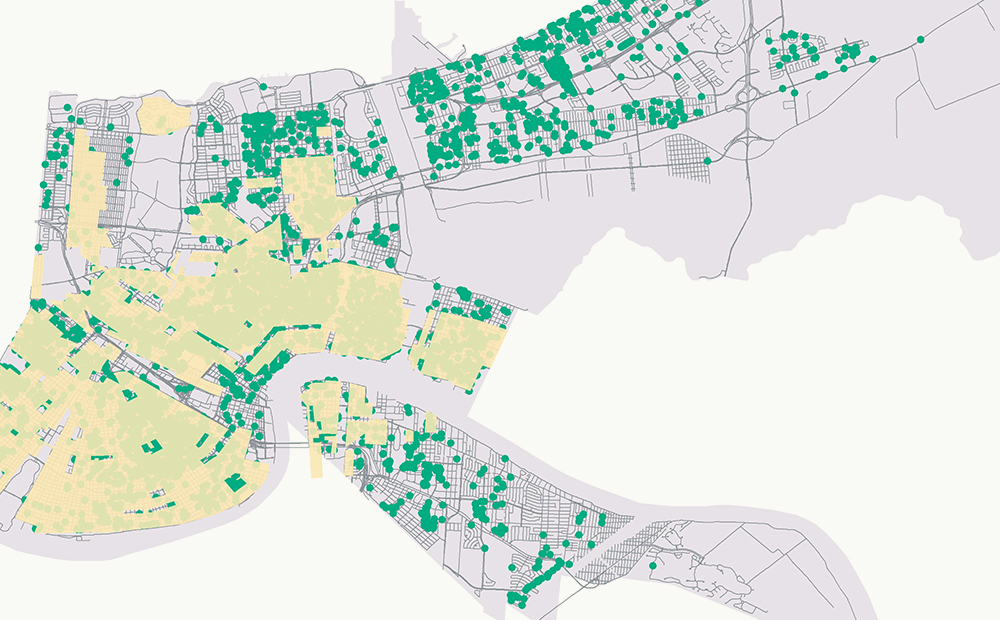
How Evictions Correspond to Past Divestment in New Orleans
We worked with Jane Place Neighborhood Sustainability Initiative as part of the 2018 Summer of Maps program to analyze evictions data in New Orleans.
Digitizing Maps Using Remote Sensing Techniques in ArcMap and R
Learn how to use image processing and remote sensing techniques in R and ArcGIS to digitize spatial data from image or PDF files.
Creating Leaflet Tiles from Open Data using PostGIS and QGIS
A guide to transforming open geospatial data into slippy map tiles to display in Leaflet or OpenLayers using PostGIS, QGIS, and QTiles.
Engineer Onboarding with Breakable Toy
My experience joining the Operations Team at Azavea. This was the first time my colleagues used the Breakable Toy apprenticeship pattern.
Preparing Data for MaxEnt Species Distribution Modeling Using R
How to use R to turn disparate environmental data into clean, usable raster data that can be fed into a MaxEnt species distribution model.
Evaluating Machine Learning Models in R: Predicting Marine Debris
Evaluating machine learning models in R with a focus on how to handle biased and imperfect data, specifically volunteer collected marine debris data.
Summer of Maps Fellows Complete Data Analysis Projects for 6 Nonprofits
Summer fellows completed projects for nonprofits, helping the organizations answer questions related to environmental, public health, and political issues.
Three (Earth) Observations from Sat Summit 2018
Here are our key takeaways from SatSummit and some thoughts to help drive innovation related to earth observation data toward impactful solutions.
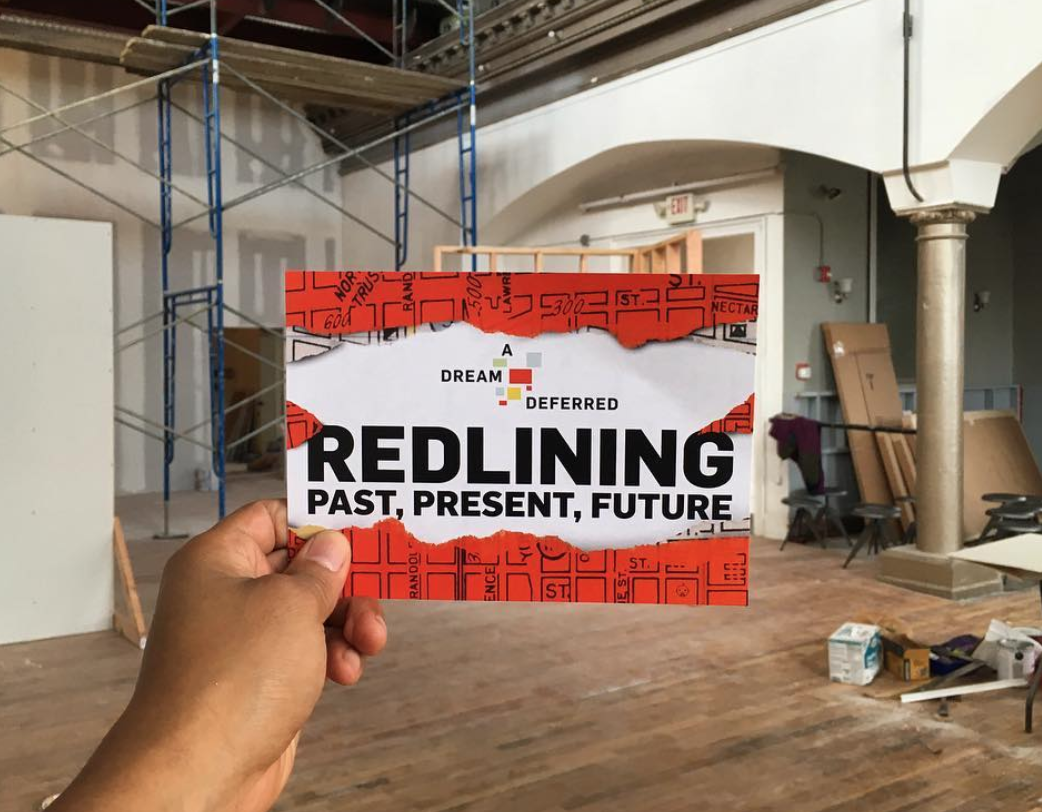
Public Redlining Exhibit Showcases Azavea’s Data Analysis Work
In September 2018, a free exhibit opened to the public on the history of redlining in Philadelphia. Read about how our Data Analytics team was involved.
Cleaning Philadelphia Campaign Finance Data with R
How to categorize, clean, filter, and prepare Philadelphia's campaign finance data for analysis, mapping, and visualization.
Geospatial Analysis of Utility Insecurity in Philadelphia
An analysis of areas vulnerable to utility insecurity completed for the Legal Clinic for the Disabled as part of the Azavea Summer of Maps program.
Cleaning Address Data for Legislative District Matching
This tutorial will teach you how to quickly and easily clean bulk lists of addresses for address to legislative district matching.
Tilegarden: Serverless Tile Rendering with AWS Lambda
This 2018 Azavea Open Source Fellowship project enables serverless Lambda-based raster and vector tile generation from PostGIS data.
Introducing Grout: a Flexible-Schema Framework for Geospatial Apps
Grout is an open source framework that empowers non-technical administrative users to directly define and modify data at the core of their application.
How to Save a Mapbox GL Web Map Extent as an Image
Learn how to generate a Data URL or image file of the current map extent from a Mapbox GL Web Map.
How to Convert Geodatabase Spatial Data and Related Tables to Vector Tiles
Use this open source data processing pipeline to convert geodatabase files to vector tiles for use in a web application.
Exploring Protected Wildlife Habitat for Every Property in New Jersey
This Azavea 10% Time project defines a process for converting big data files to vector tiles and enables a user to visualize protected wildlife habitat.
Generating Pyramided Tiles from a GeoTIFF using GeoTrellis
A tutorial for generating pyramided map tiles (also called Slippy Map tiles) from a GeoTIFF using GeoTrellis, which can be used in Leaflet or OpenLayers.
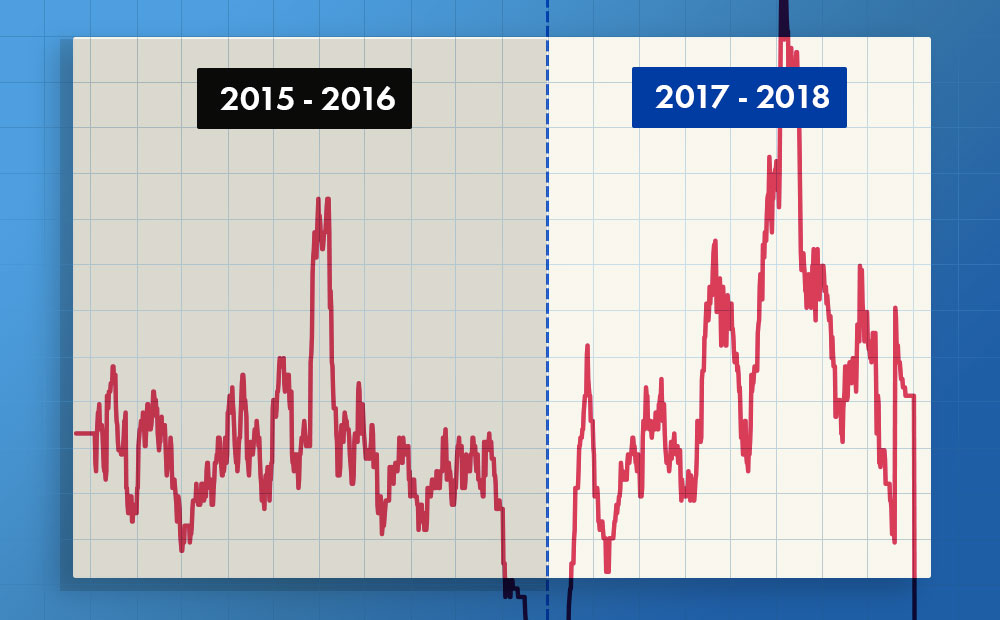
Visualizing Turbulence in Politics using Cicero Data
Visualizing turbulence in politics as a function of the number of elected officials that leave office before the end of their term using Cicero API data.
Azavea Recognized on B Lab’s 2018 Best For Workers List
This week, Azavea earned a spot on the ‘B Lab’s Best For Workers List’ for the second time since 2013. The Best for Workers List honors B Corporations that score in the top 10 percent of more than 2,400 Certified B Corporations on the Workers section of the B Impact Assessment.
Trajectory of Geospatial Open Source Innovation Discussed at FOSS4G NA
Earlier this month, we presented, exhibited, and attended talks at FOSS4G NA in St. Louis. Read our recap of events and view the slides from our presentations.
Azavea Summer of Maps Fellows to Work on Six Nonprofit Projects this Summer
Three fellows will work with mentors to complete projects for six nonprofits as part of the 2018 Azavea Summer of Maps program.